Slope of Hope Blog Posts

Slope initially began as a blog, so this is where most of the website’s content resides. Here we have tens of thousands of posts dating back over a decade. These are listed in reverse chronological order. Click on any category icon below to see posts tagged with that particular subject, or click on a word in the category cloud on the right side of the screen for more specific choices.

FINVIZ Jump Start (by Leisa)

By -

Given Ryan's consistently hard work and the types of screens that he uses and reports, I was surprised to learn that he was unaware of FINVIZ.  FINVIZ is a very powerful tool with instant information at your fingertips.  I thought I would do a quick post on it to head you in the right direction–I hope that you'll excuse my evangelical fervor. 

Access to information–quickly and easily–will help you find better opportunities.  I use an amalgamation of tools:  Stockcharts, FINVIZ and StockFetcher.  In addition to access to information, being able to manage information is key as well.  An effective idea management system will help you keep your ideas in a spot where you can review them and retrieve them. How many V-8 moments have you had when you had a great idea/stock pick only to see that it made its anticipated move and you were not on board?  Maybe you guys are more organized than I am. 

Finviz:  Start at the home screen here.  See my GREEN text boxes for highlights
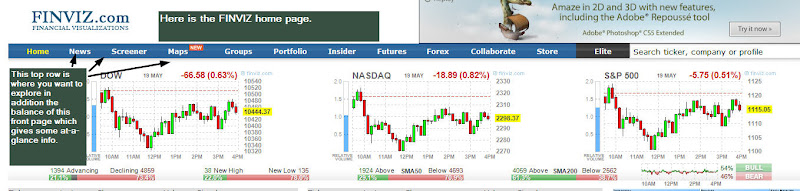

This
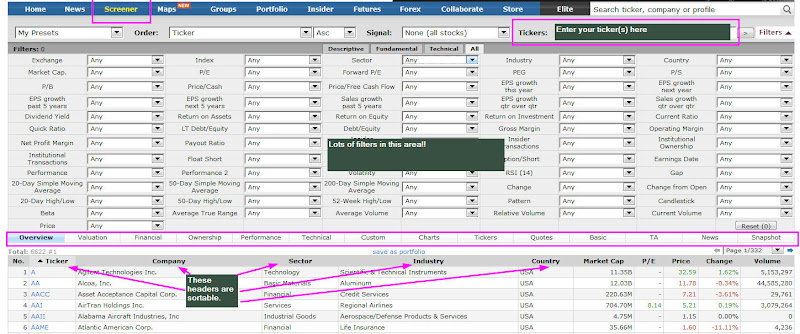
next screen is where the real power is.  It is under screener.  You can flip whatever switches you like through using the drop down boxes to give the results you are looking for.  As you might imagine, I'm particularly fond of the industry/sector information. There are several features that you will enjoy using. Grab your favorite beverage and take the tour. I want to point out a few things. 

If you want to load tickers into your own charting system, it is easy as pie.
This is where I spend much of my time looking for "stuff"–notice the Sector and the Industry boxes—if you want to see stocks/charts quickly in an particularly group, this is a great way to quickly do it:

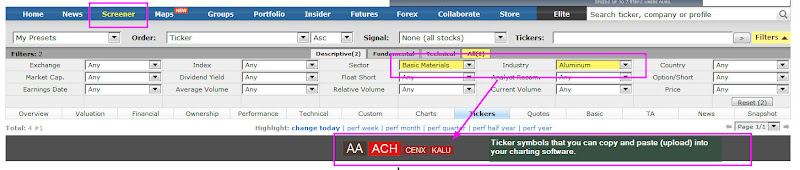
All you have to do is copy the tickers and past them into your favorite charting software.
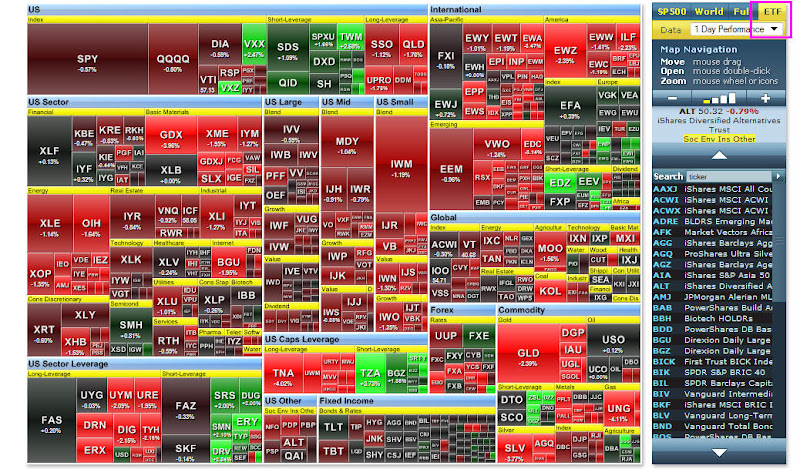
I see folks ask about ETF's frequently.  The "MAPS" feature and choosing the ETF in the far right hand corner helps you select an ETF/N in the area of your choosing.

This was meant to give you just a few slices of the information available. I hope that you find it useful in uncovering opportunities. And when you find them, you can use the "Portfolio" section to record them. 
Note, I have no affiliation with FINVIZ other than being an appreciative user. I'll add that Tim mentioned them a couple of years ago, and I've been using them ever since.  I only use the freebie stuff, and I cannot vouch for their premium services.

Volume by Price Profiles: NPK (by Leisa)

By -

Since I introduced to you Volume by Price profiles, I will periodically share with you some charts that I run across that might have some approaching inflection points that are made all the more vulnerable by volume concentrations. Npk

NPK has a pretty significant VbP bar in the $105 – $110 area.  I believe that a break below $105 would likely trigger some stops and send the stock downward quickly in the air pocket below. 

Position:  none as of post upload

Weekly Sector Report: 05/14/10 (by Leisa)

By -


The market had a bounce last week, with the DJUS Total Stock Market Index advancing 2.74%. There are 148 subsectors. You can easily see the top/bottom performers by going to the WSJ industry page.
Below is a 1 week performance view for the 10 best/worst performing subsectors (industries):

(data courtesy of WSJ).

You can find this information for a number of time periods, and it it updated daily. It's a great way to perform an end of the day review and wrap your head around the market action beneath the indices. I've created a full report of the 148 sectors sorted by weekly performance along with the weekly/daily charts of the 24 broad sectors here. You will need to rotate the chart pages counter clockwise for easy viewing.
My individual charts use a 13/34 period exponential moving average. I'm interested in the relationship of these two lines to each other (e.g. is the 13 moving toward or away from the 34?) and the relationship of price to these two lines. I included thumbnail sketches of all 24 sectors so that you can see all of them at a glance. Stockcharts uses a 20/50 moving average that is not editable in this thumbnail view. The same concept is at work though–short moving averages v. longer moving averages and the price relative to those. Currently all 24 sectors see price action below the 20 period and 8 of the 24 sectors have the 20 day below the 50 day.

Toshi-Tim: Trader, Writer and Chick Magnet Extraordinaire! (by Leisa)

By -

Tim Knight, Fergie (l), Bonnie (r)


Tim_Fergie_Bonnie_edit

I think that Bifferific is cooking up something to consolidate photos–and I think that there might be a caption contest on a few choice pictures (Tim's idea) in the offing.  Naturally we will cull through any that might be embarrassing or indictable in any way.

Here's one of my first "favorites" that I wanted to share. Clearly Royal with Cheese has NOTHING on Tim.

Travelogue: Las Vegas

By -

Lv1
Yesterday was a cruel travel day, rewarded with a night of conviviality among advance party Slopers.  Telling people in my offline life that I was meeting on-line people has been met by some hearing of this adventure incredulity colored by excitement (wow!) and cautions (huh!).  At dinner on Saturday, my 22 year old daughter said:  "Mom, do you know how dangerous it is to go out to meet people you've met on the internet?  That is what "Lifetime" movies are made of."

Given the ingenuity of Sony's proprietary interfaces, the group photos from last night are not retrievable from Doolie's camera.  I was too stupid tired to manage photos very well, otherwise I would have more to offer.  This pic is simply of the view from my room at the Vdara. We will have photos of the group soon. 

However attractive, funny, charming, erudite any of the group may seem on line, I'm here to tell you that it is a lie. The simple truth of the matter is this:  that collection of traits is munificently distributed among these folks–what a radiant, smart, funny and nice group of folks.  It was also great to introduce our spouses to our on-line friends.

It is possible that the earth may wobble on its axis or get wobbly in its orbit this evening.  Perhaps our group's convening is yet another sign for Bluetrader, Iggy and ComicFx.

P. S.  Iggy, tell Ms. Iggy that some of the Hurricane hockey players were in proximity..Carson ???? being one of them.