In my premarket video on Tuesday I was looking at the setup and the historical stats and, was saying that a consolidation was likely to start the week and, then we would see what the bulls could do with the very bullish historical stats on Thursday and Friday. Well, they came, they saw, and they have conquered so far, so as it stands we now have the start of what could be a serious bullish break up on SPX.
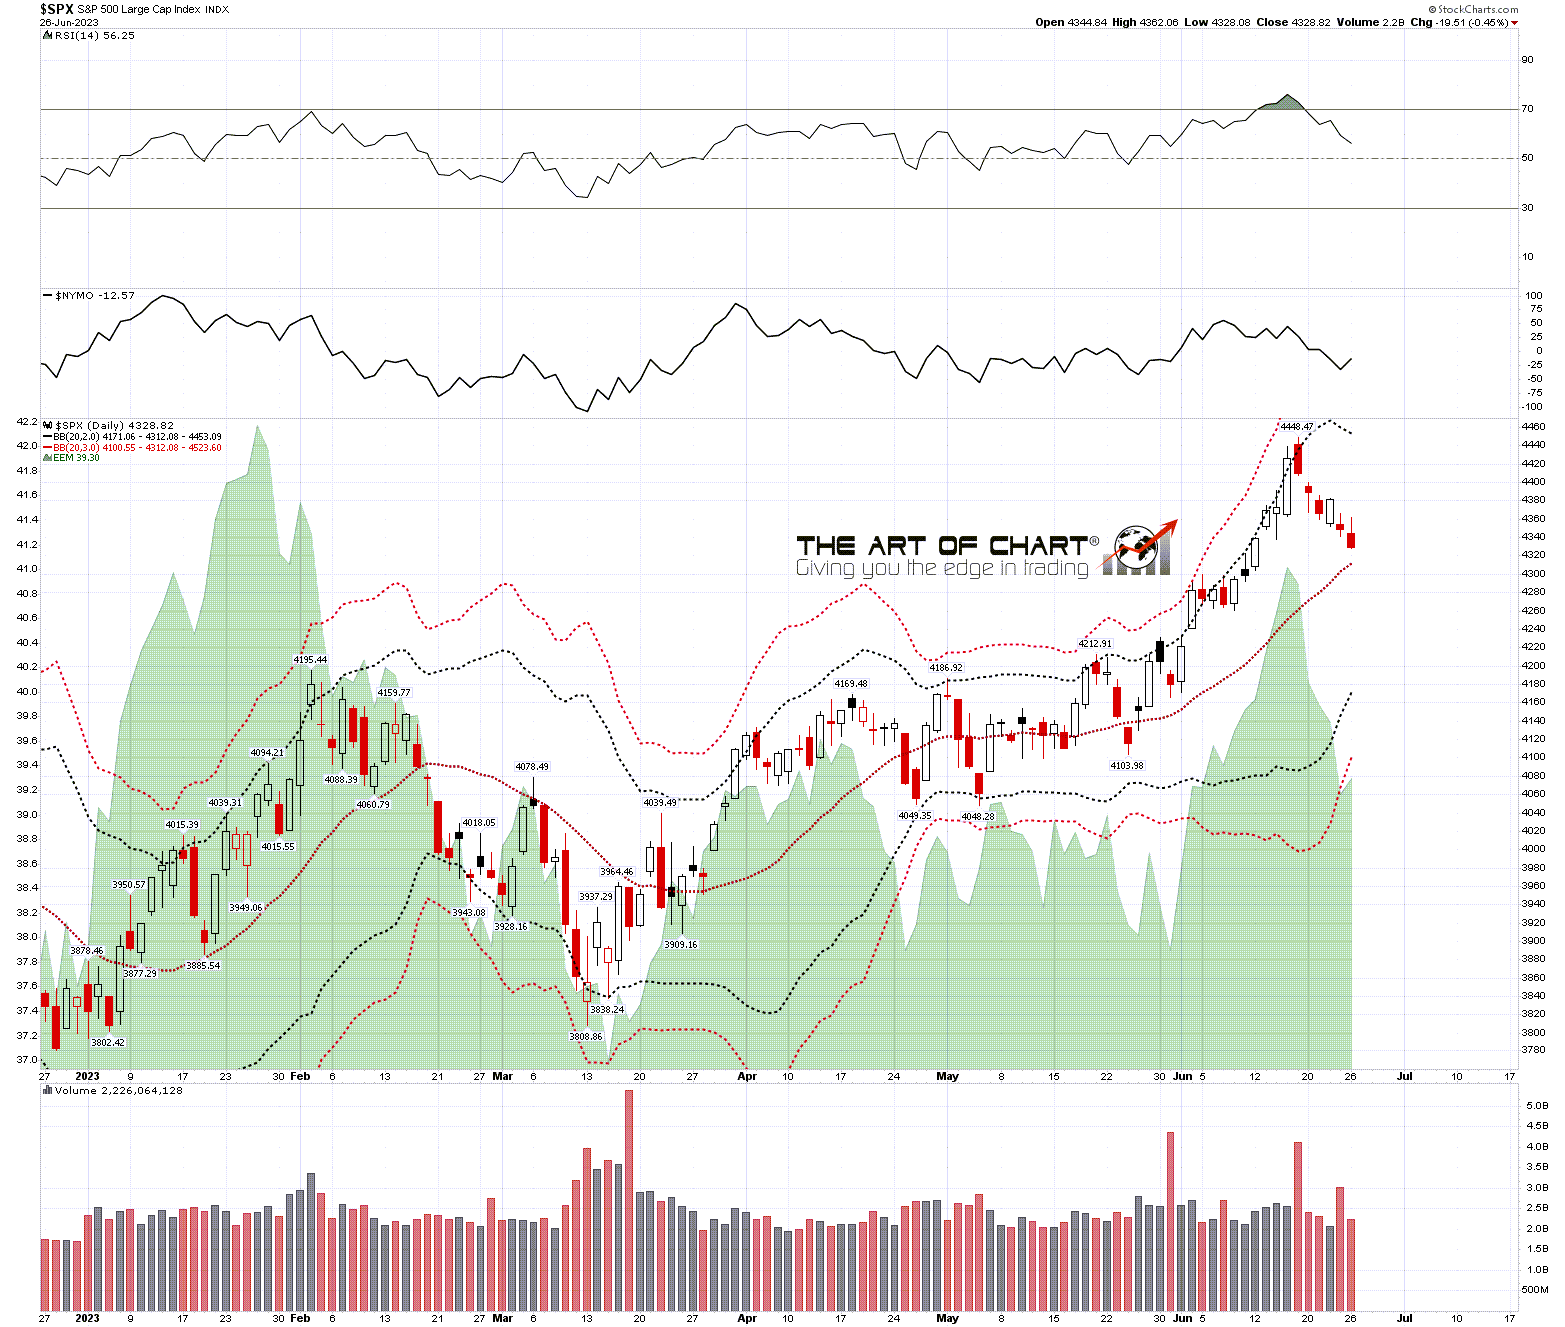
Short term though, SPX is so stretched that the high on Friday was only three handles below the close on the daily 3sd upper band, which is a rare event, so I did what I like to do with rare events, I looked back and crunched some numbers looking at previous examples.
(more…)