Slope of Hope Blog Posts

Slope initially began as a blog, so this is where most of the website’s content resides. Here we have tens of thousands of posts dating back over a decade. These are listed in reverse chronological order. Click on any category icon below to see posts tagged with that particular subject, or click on a word in the category cloud on the right side of the screen for more specific choices.

S&P 500 E-mini Futures Index Stalls Below Resistance

By -

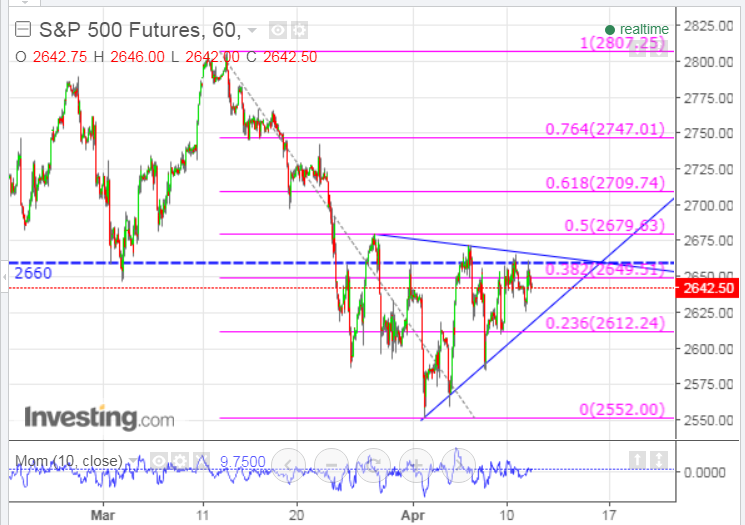
As at 6:30 pm ET tonight (April 11) the S&P 500 E-mini Futures Index (ES) is trading just below a couple of intraday resistance levels, namely, 2649.51 (40% Fib retracement level) and 2660 (triangle apex), as shown on the following 60 minute (extended hours) chart. The momentum indicator is just above zero.

We’ll need to see a clear break and hold above or below this triangle, with corroborating momentum, to gauge direction and sustainability. Whether that happens by Friday is anybody’s guess at this point, particularly with the Syria issue still developing.

Has Canada’s TSX Index Reached Its Limit…Recession Looming?

By -

Not much has changed with respect to price action since I wrote my last post about Canada’s TSX Index, as shown on the following monthly chart. It’s still dangling precariously outside of its long-term upward trending triangle formation, after dropping 7.22% from its record high set on January 4th. The momentum indicator is in downtrend, but remains above the zero level.

(more…)

China’s Shanghai Index Remains Trapped

By -

China’s Shanghai Index remains firmly ensconced in a large sideways consolidation zone in between major resistance at 3368 and major support at 3000, as shown on the following monthlyweekly and daily charts.

The momentum indicator is below zero on the monthly and weekly timeframes, and is just above it on the daily. In the short term, watch for a hold above zero on any rally that may continue from tonight’s action following on from President Xi’s speech to the BOAO Forum for Asia which finished a short time ago.

(more…)

Wells Fargo Struggles to Regain a Foothold

By -

Wells Fargo is struggling to re-enter its long-term upward-trending Andrew’s Pitchfork channel, as shown on the following monthly chart of WFC.

The momentum indicator has fallen below the zero level on this timeframe and has formed a lower swing low…hinting of further weakness ahead. And, as I mentioned in this February post, major support is at 50.00, so a break and hold below would likely see price retest the October 2016 lows, or drop lower.

* UPDATE @ closeWFC continued its intraday drop and closed near its low of the day at 52.26. (more…)