Slope of Hope Blog Posts

Slope initially began as a blog, so this is where most of the website’s content resides. Here we have tens of thousands of posts dating back over a decade. These are listed in reverse chronological order. Click on any category icon below to see posts tagged with that particular subject, or click on a word in the category cloud on the right side of the screen for more specific choices.

Where’s Money Parked Globally This Year?

By -

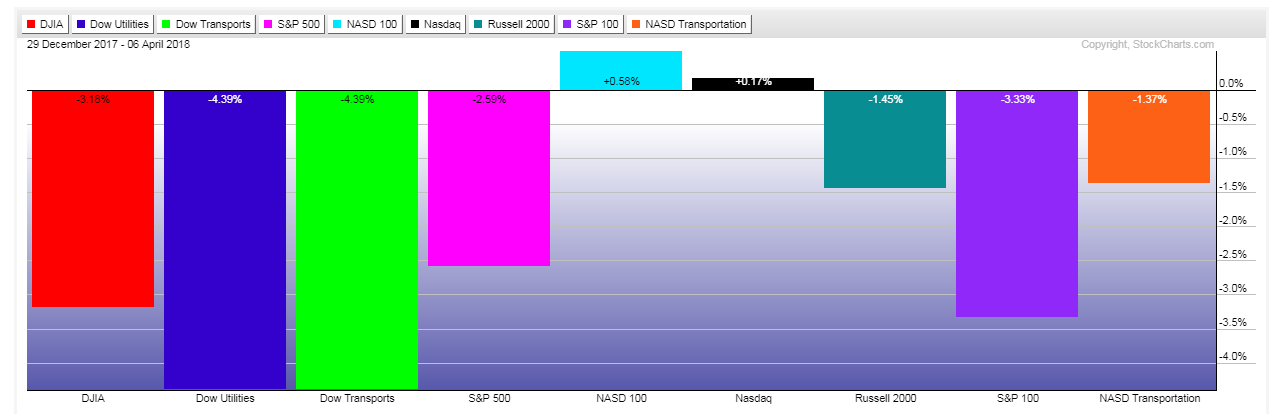
The following year-to-date graphs simply show, at a glance, which global indicesUS sectors, commoditiescurrenciesbonds, as well as the FAANGs, have gained/lost the most, so far.

My only comment is keep an eye on China, the Canadian and Aussie Dollars, as well as Canada and Australia, in particular..further weakness could hint of a recession in the not-too-distant future.

(more…)

S&P 500 Index Over-Extended on a Fibonacci Basis

By -

The following monthly chart of the S&P 500 Index (SPX) simply shows the monthly closes from its inception.

January’s (2018) close of 2823.81 nearly tagged its long-term 140% trend-based Fibonacci extension level of 2836.

As of 2:03 pm ET today (Monday), its price is currently below its 1.27% Fibonacci extension level of 2625.

Failure to recapture and hold 2625 could see price eventually decline further to 2220 (its 1% Fib extension level), or lower to around 2100, due to a lack of major price consolidation support below its current price until then. (more…)

Tesla’s Worst Month May Not Be Its Last

By -

March was Tesla’s (TSLA) worst-performing month since its IPO in June 2010, as shown on the following monthly chart. It may not be its last.

The March candle closed just above a medium-term 50% Fibonacci retracement level and below a long-term -50% Andrew’s Pitchfork channel line.

We may see price decline further to the bottom of the pitchfork where it converges with the 60% Fib level at 236.00. Inasmuch as the momentum indicator has made an all-time swing low and is diverging with the overall price uptrend, it is hinting that further weakness lies ahead. Alternatively, major resistance sits at 300.00 (confluence of 20-month VWMA and 40% Fib level).

A break and hold below 236.00 would not bode well for this stock. (more…)

Further Volatility Ahead for FAANGs

By -

Amazon plunged last week after media rumours surfaced about President Trump’s intentions towards its taxation, as shown on the following daily chart of AMZN.

A hold below near-term resistance of a 50% Fibonacci retracement level at 1441.74 could see a retest of 1400.25 (60% Fib retracement), or lower. The dramatic plunge on the momentum indicator signals further volatility and wild price swings ahead for this stock.

(more…)