Slope of Hope Blog Posts

Slope initially began as a blog, so this is where most of the website’s content resides. Here we have tens of thousands of posts dating back over a decade. These are listed in reverse chronological order. Click on any category icon below to see posts tagged with that particular subject, or click on a word in the category cloud on the right side of the screen for more specific choices.

Twitter Caught in “Fibs”

By -

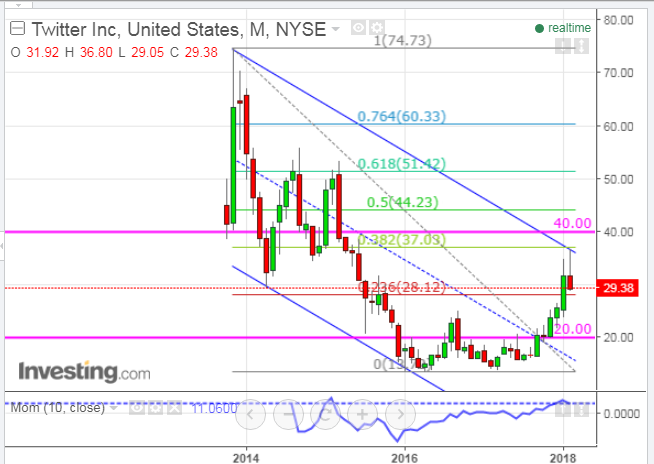
Twitter (TWTR) is stuck in between two long-term Fibonacci retracement levels (after nearly tagging and retreating from the 40% Fib) and a downtrending channel, as shown on the following monthly chart.

Momentum had been building since mid-2017, but was capped in mid-February.

It is 29% lower than it was at the close of its first week of its IPO (November 7, 2013), and it has spent more time under water since then, as shown on the weekly chart below.

A drop and hold below 28.00 could see a further decline to 20.00, or lower. Alternatively, a break and hold above 40.00 would be needed to confirm a sustainable price rally.

(more…)

Russian Index Breakout Failure

By -

I last wrote about the Russian Index in my post of September 8, 2017.

Since then, it has broken above one downtrend line, popped above its major resistance level of 1200, spiked briefly above its next major downtrend line, only to fall back below, as shown on the following monthly chart.

Momentum is rising tepidly and is above the zero level.

If this index can remain above 1200, while maintaining momentum above zero, we may see a second (possibly successful) trend line breakout attempt. However, I’d like to see a higher swing high made above the December 2016 swing high on momentum to confirm any sustainable rally. Otherwise, a drop and hold below 1200 will likely see a retest of 1080, or lower. (more…)

MSCI World Index at Critical Support Level

By -

I last wrote about the MSCI World Index in my post of February 10 as one of the volatility gauges to monitor for clues in equity direction. At that time, its price was 2050.90 and I mentioned that 2032.74 was a critical major support level to watch.

Since then, it has dropped further and closed just above that level on Friday, as shown on the following weekly chart.

I’d reiterate that a drop and hold below that level could send all world markets into a tailspin. The dramatic and swift plunge of the momentum indicator (which began in late January) is hinting of further weakness ahead on this timeframe, unless we see a swifter and convincing (sustainable) bounce soon. In the meantime, look for wild swings in this index, particularly this coming week, and beyond. (more…)

The Fate of Facebook’s Momentum About-Face

By -

The following monthly chart of FB shows that price has plunged to near-term support defined by its longer-term uptrend channel median and 23.6% Fibonacci retracement level (166.22).

The reversal from its all-time high made last month has been accompanied by accelerating (to the downside) Momentum (peaked in October 2017) and Rate-of-change (peaked in September 2017) technical indicators which, in fact, reversed well ahead of price.

Neither of these two indicators have broken below their respective zero levels since the early months following FB’s IPO. A drop to, and hold below, zero on this monthly timeframe on these indicators could spell serious trouble for FB in the longer term. In this regard, watch for any drop in price to, and hold below, its next support level around 148.00 (channel bottom plus 40% Fib retracement level). (more…)