It looks like this third attempt by Republicans to repeal and replace Obamacare has failed…and that it will be a dead issue once September has 30th has passed.

Slope initially began as a blog, so this is where most of the website’s content resides. Here we have tens of thousands of posts dating back over a decade. These are listed in reverse chronological order. Click on any category icon below to see posts tagged with that particular subject, or click on a word in the category cloud on the right side of the screen for more specific choices.
It looks like this third attempt by Republicans to repeal and replace Obamacare has failed…and that it will be a dead issue once September has 30th has passed.
Further to my post of September 25 (regarding GOP legislation failures), watch for an increase in volatility and a potential rotation out of equities (SPX) and into commodities (GOLD and OIL) and currencies (US Dollar) for Q4 of 2017.
With respect to volatility, watch for a potential “SELL” signal to form on the RSI, MACD and PMO technical indicators, as price whipsaws in between major resistance at 250 and major support at 200, as shown on the following SPX:VIX ratio chart.
 |
|
SPX:VIX Daily Ratio chart |
As early polling results on Sunday show that, although Chancellor Angela Merkel has been elected for a fourth term, her party has lost ground to the far right, and a coalition government will need to be formed amid much discussion over, what could take, months.


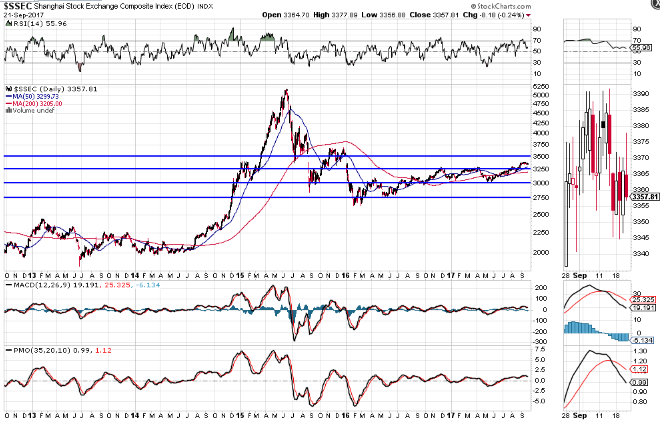
The Shanghai Index has recently begun to rally, after remaining in a large sideways congestion zone since mid-2015, as shown on the following Daily chart.
It’s currently trading under the bullish influence of a moving average Golden Cross formation, with the RSI, MACD and PMO technical indicators making a corresponding higher swing high. However, the MACD and PMO have recently made a bearish crossover “SELL” signal…if the RSI drops and holds below the 50 level, we may see price drop and retest near-term support at 3250, or fall to, potentially 3000, or lower.
The USD/JPY Forex pair is mired in a 31-year sideways congestion zone, as shown on the following Monthly chart.
Major resistance and support are formed by a long-term 40% Fib retracement level at 124.34 and 23.6% level at 105.69, respectively. The momentum and rate of change technical indicators have been in downtrend since mid-2013.
Until we see a clear breakout above or breakdown below one of those Fib levels, the Yen will likely continue to be subject to volatile, non-directional whipsaw price action in between them.

