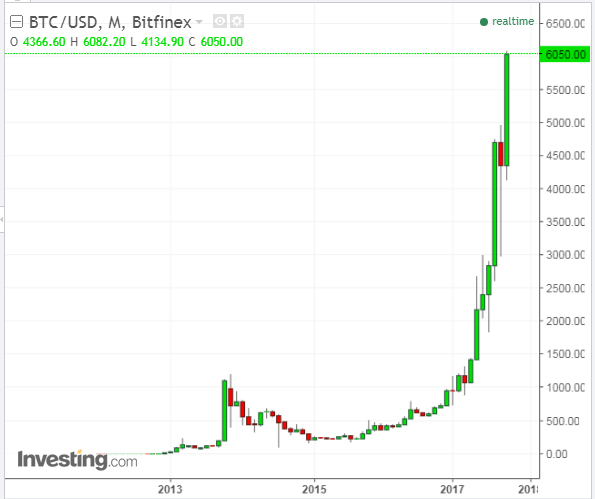
After plunging to 3000 six weeks ago, Bitcoin snapped back and reached 6000+ today (a 100% increase during that time), as shown on the following Monthly chart, and, as noted in my last post (originally written on September 4th and updated periodically, with comments and charts, to, and including, today).
Slope of Hope Blog Posts
Slope initially began as a blog, so this is where most of the website’s content resides. Here we have tens of thousands of posts dating back over a decade. These are listed in reverse chronological order. Click on any category icon below to see posts tagged with that particular subject, or click on a word in the category cloud on the right side of the screen for more specific choices.
Will the SPX Reach 2600?
I last wrote about the SPX:VIX ratio on September 30.
Price action on the Monthly ratio chart below shows an inability, so far, for volatility to be held at bay, while the SPX continues to make new highs, almost daily.
It has failed to hold, with conviction, above the 250 level and advance above its next resistance level, which is a 161.8% external Fibonacci level at 280.
FAANG Rotation: Risk On or Risk Off for Q4?
I last wrote about the five FAANG Tech stocks at the end of June.
Since then, we’ve seen rotation in and out of these stocks, as depicted on the following four percentage gained/lost graphs of varying lengths of time…namely, Year-to-date, 2017 Q3, the month of September, and the past week, respectively.
Third Down…One To Go: 2017 Q4 Looms for U.S. Equities
The following charts and graphs present a simplified birds-eye view of how the S&P 500 Index, and its volatility, performed in Q3 of 2017, as well as year-to-date.
But, first, a look at the Major Indices and 9 Major Sectors and how they have fared year-to-date and during Q3…
MAJOR INDICES
Eight of the nine Major Indices, namely, the Dow 30, Dow Transports, S&P 500, Nasdaq 100, Nasdaq Composite, Russell 2000, S&P 100, and Nasdaq Transportation Indices closed out Q3 at or near all-time highs, as shown on the following 1-Year Daily charts. (more…)
Will the Dow Jones US Retail REITs Index Recover From Its 34% Decline?
After dramatically dropping 34% from its historical high of 151.85 from mid-2016 to a low of 99.98 in May of this year, the Dow Jones US Retail REITs Index has been stuck in a sideways trading range and is attempting to maintain a stable position above a long-term 40% Fib retracement level of 102.42, as shown on the following Monthly, Weekly and Daily charts.
Longer term, the Monthly momentum and rate of change technical indicators are hinting of further weakness.
In the medium term, the Weekly momentum and rate of change technical indicators are hinting of potential strength. (more…)


