WORLD MARKETS
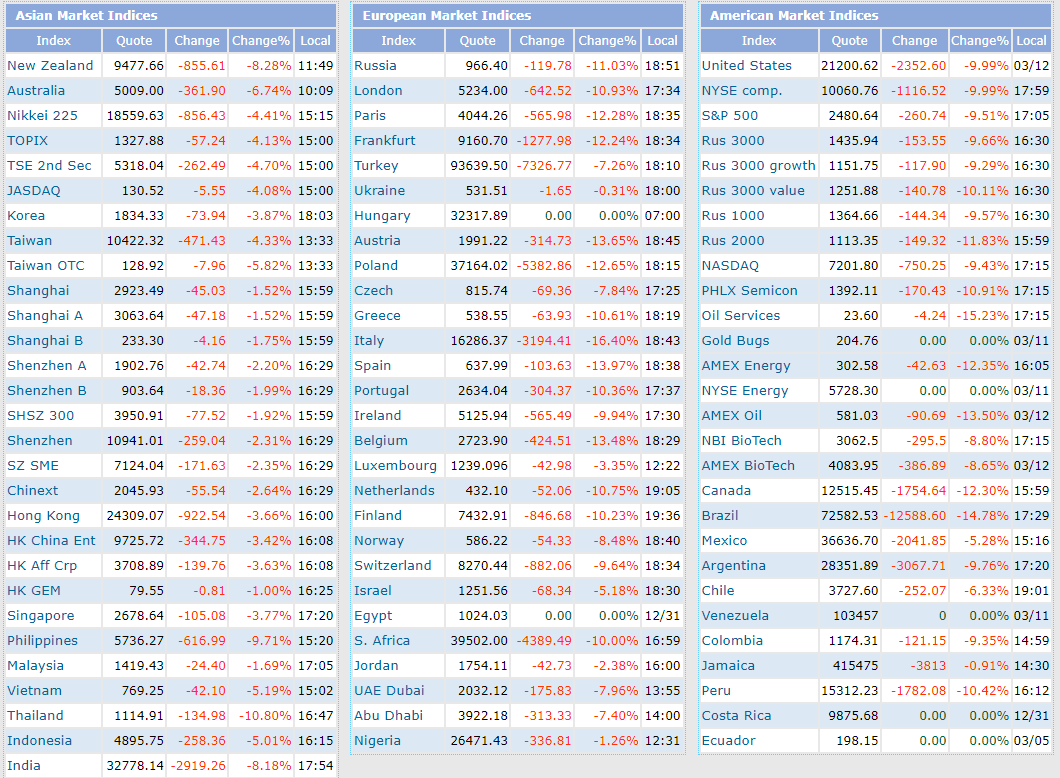
Further to my last post, world markets continued to plunge in Thursday’s trading, as shown below.
Slope initially began as a blog, so this is where most of the website’s content resides. Here we have tens of thousands of posts dating back over a decade. These are listed in reverse chronological order. Click on any category icon below to see posts tagged with that particular subject, or click on a word in the category cloud on the right side of the screen for more specific choices.
Further to my last post, world markets continued to plunge in Thursday’s trading, as shown below.
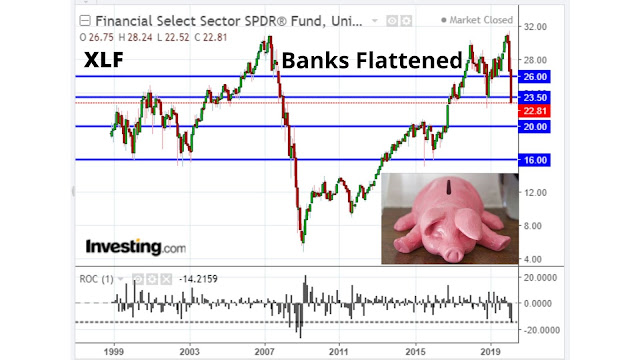
There is lots of “air” below Monday’s closing price of 22.81, as shown on the monthly chart below of the U.S. Financial Sector (XLF).
Major support lies at 20.00, while major resistance (formerly support) is now 23.50.
As of Monday’s close (2746.56) (it’s a full moon today), the S&P 500 Index (SPX) is -18.89% from its peak at 3393.52 on February 19 — just 1.11% from reaching ‘bear market’ status — amid a sea of red following a meltdown in global markets.


Saudi Arabia’s Tadawul Index (TASI) gapped down on the open and closed at 6846.36 on Sunday. It’s back around the October 2004 lows. It has gapped well below the neckline of a sloping bearish head and shoulders formation that began in late 2017, as shown on the following weekly chart.
It’s currently caught in a weak level of prior price support and is vulnerable to further downside, nothwithstanding the oversold RSI level.
(more…)Here’s a snippet of what I wrote in my post of November 9, 2018 with respect to world market headwinds and ‘harmonic globalism’…
(more…)