What a mess! A drop and hold below 100 will signal that a big downdraft is in store for equities, as shown on the following Monthly SPX:VIX ratio chart.
Further background information can be found at this last post on the ratio.

Slope initially began as a blog, so this is where most of the website’s content resides. Here we have tens of thousands of posts dating back over a decade. These are listed in reverse chronological order. Click on any category icon below to see posts tagged with that particular subject, or click on a word in the category cloud on the right side of the screen for more specific choices.
What a mess! A drop and hold below 100 will signal that a big downdraft is in store for equities, as shown on the following Monthly SPX:VIX ratio chart.
Further background information can be found at this last post on the ratio.
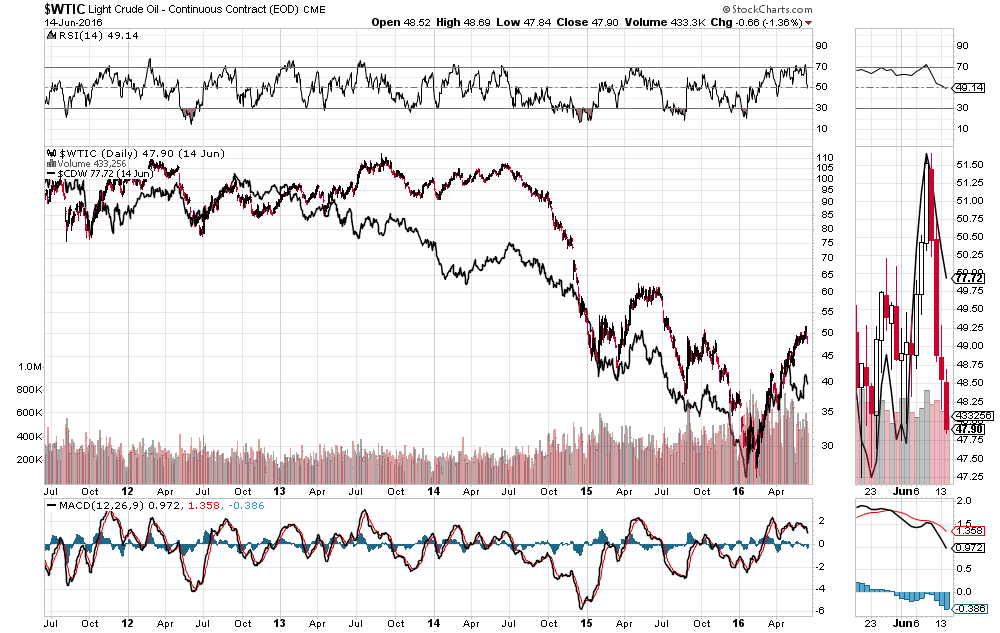
If WTIC Crude Oil breaks below it’s current (very tight) uptrend line, watch for the Canadian Loonie to tank.
As shown on the following 5-Year Daily chart comparing the two, they normally trade lock-step. Note the recent divergence of the Loonie starting in April and the fact that the RSI and MACD have fallen below the 50 level…which are hinting of further weakness ahead for Oil.
The USD/CAD Forex pair is well overdue for a bounce at the median of a long-term regression channel and the 40% Fibonacci retracement level, as shown on the Monthly chart below.
The Canadian dollar is price-sensitive to the price of WTIC Oil, so I’d keep a close eye on its action following the inaction of the participating countries to lower oil supply at this weekend’s Doha meeting…Oil is -2.21 at 39.50 as I write this post on Sunday evening.

In my post of December 29, 2015, I stressed the importance of the Financials ETF (XLF) in, potentially, propelling the SPX to an increase of 5-6% for 2016.
You can see from the Daily ratio chart below of XLF:SPX, that price weakened considerably afterwards and fell to new lows not seen since 2012. Price is attempting to stabilize above that low, but all three indicators are still in downtrend and display new “SELL” signals, and price action is still under the bearish influence of the Death Cross formation of the moving averages.
If price drops and holds below near-term support of 0.0105, we could see a significant drop in the SPX, likely to new lows for the year, as I mentioned on April 3.

Further to my posts of January 29 and February 17 (& March 3 update), price action on the SPX:VIX ratio has rallied and is now in between major support of 150 and major resistance at 160, as shown on the following monthly chart. The momentum indicator has also risen above the zero level and is hinting of higher prices to come at some point on this longer term timeframe.

