Slope of Hope Blog Posts

Slope initially began as a blog, so this is where most of the website’s content resides. Here we have tens of thousands of posts dating back over a decade. These are listed in reverse chronological order. Click on any category icon below to see posts tagged with that particular subject, or click on a word in the category cloud on the right side of the screen for more specific choices.

New “Buy” Signals for Equities

By -

Note from Tim: I just want it made clear that Slope’s beloved Strawberry Blonde composed the piece below, which I appreciate. To be clear, your permabearish friend (me) remains short, having bumped his positions from 50 to 75 this morning. Having said that……….

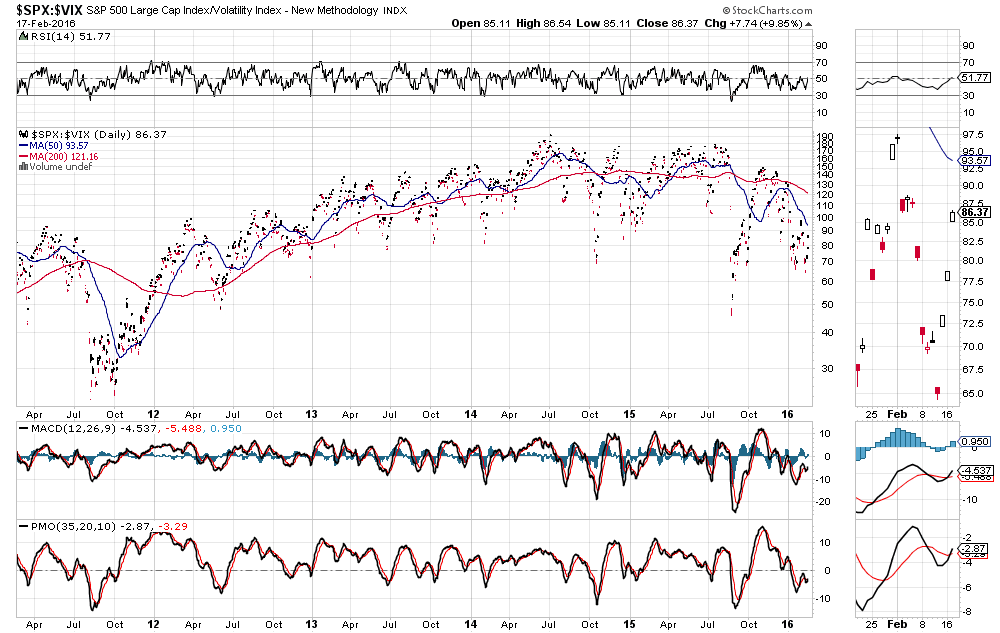
New “BUY” signals have just formed on the RSI, MACD and PMO indicators for:

  • SPX:VIX ratio: Price still needs to cross and remain above the 100 level, as outlined in my post of January 29th, and, thus, is still aimless and directionless within the “Uncommitted Zone.”

(more…)

It’s Now or Never For Bulls

By -

Was today’s (Friday’s) world-market rally serious and sustainable, or simply a knee-jerk reaction to Japan’s surprise NIRP (negative interest rate policy) announcement last night (including some shorter-term short-covering action) and “end-of-month window dressing” by fund managers?

Perhaps the following update to my last post will provide some further insight into that question, as I review a variety of markets.

YM, ES, NQ, TF and NKD E-Mini Futures Indices:

(more…)

World Market Index: Is This Capitulation?

By -

I last wrote an update about the World Market Index on January 8th.

Since then, this index has continued to drop below the critical support level of 1600 and price now sits just below the next support level of 1550.

As you can see from the 5-Year Daily chart below, it’s a long way down to major support at 1350. All three indicators point to lower prices…but, the swings are large, and we may see some kind of bounce, although it’s not clear as to when or at what level that may occur.

If the U.S. markets are going to lead global markets to some kind of bounce, it’s worthwhile monitoring the price action of the SPX and the SPX:VIX ratio, as I discussed in my post of January 15th, for possible clues as to timing of such a bounce.

(more…)

SPX: In the Grand Scheme of Things

By -

The Monthly chart below of the SPX shows where price closed today (Friday) in relation to its lows of 2009. The price has been bouncing in between two external Fibonacci retracement levels (127% and 161.8%) since October 2014 — which represent major resistance and near-term support levels.

A break and hold below near-term support (at 1,823), puts the next support level at, between 1,730 and 1,735 — a confluence of the 40% Fibonacci retracement level (taken from the October 2011 lows to the 2015 highs) and the 127% external Fibonacci retracement level (taken from October 2014 lows to the 2015 highs).

The next chart shows the percentage gained on the SPX from the lows of 2009 to the highs of 2015, as well as where price sits today in percentage-gained terms. The SPX is still around 156% above its 2009 lows, in the grand scheme of things.

(more…)