
The Monthly chart below of the SPX shows where price closed today (Friday) in relation to its lows of 2009. The price has been bouncing in between two external Fibonacci retracement levels (127% and 161.8%) since October 2014 — which represent major resistance and near-term support levels.
A break and hold below near-term support (at 1,823), puts the next support level at, between 1,730 and 1,735 — a confluence of the 40% Fibonacci retracement level (taken from the October 2011 lows to the 2015 highs) and the 127% external Fibonacci retracement level (taken from October 2014 lows to the 2015 highs).

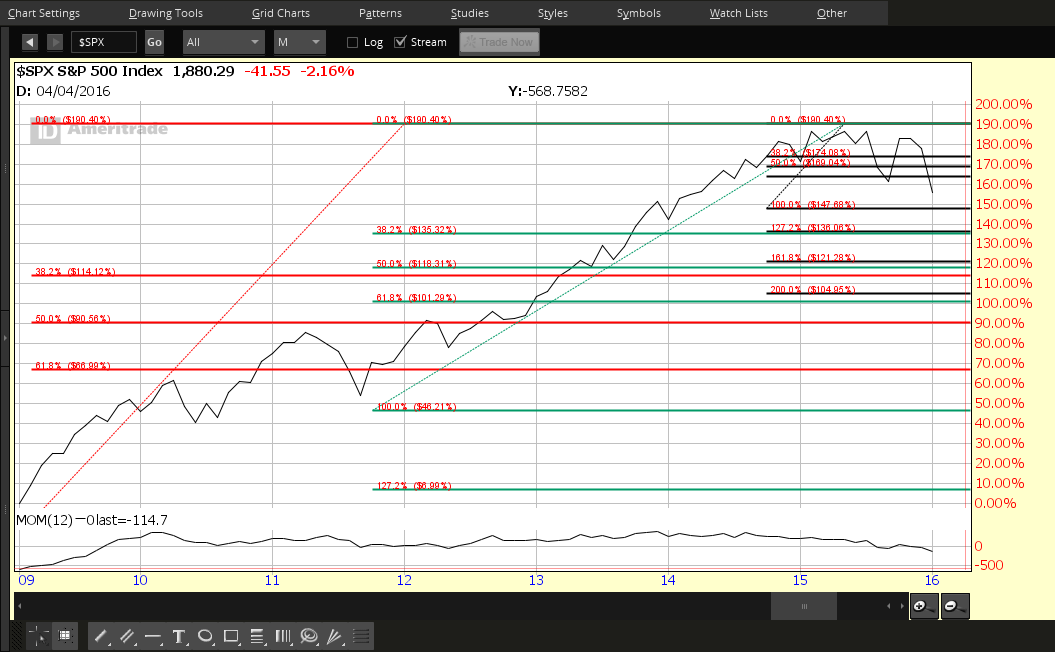
The next chart shows the percentage gained on the SPX from the lows of 2009 to the highs of 2015, as well as where price sits today in percentage-gained terms. The SPX is still around 156% above its 2009 lows, in the grand scheme of things.
So is it time to panic? Perhaps the time would be if/when price drops and holds below 1,823, inasmuch as major support sits far below, between 1,575 and 1,625 (quadruple Fibonacci confluence).
However, we will likely see continued volatile swings in both directions until a new trend is established either way, which could take most, if not all, of this year. In the meantime, it’s worth keeping an eye on the SPX:VIX ratio, as I discussed here, to gauge volatility strength/momentum.
