Slope of Hope Blog Posts

Slope initially began as a blog, so this is where most of the website’s content resides. Here we have tens of thousands of posts dating back over a decade. These are listed in reverse chronological order. Click on any category icon below to see posts tagged with that particular subject, or click on a word in the category cloud on the right side of the screen for more specific choices.

The Composite Counts

By -

Incredibly, it was just over three weeks ago that the Santa Claus rally had exhaled its last breath, and we begin a breakdown that has been thrilling, riveting, and exhausting. December 30th seems like a lifetime ago, but it wasn’t, and we moved in the span of two weeks to price levels I thought would take months to achieve.

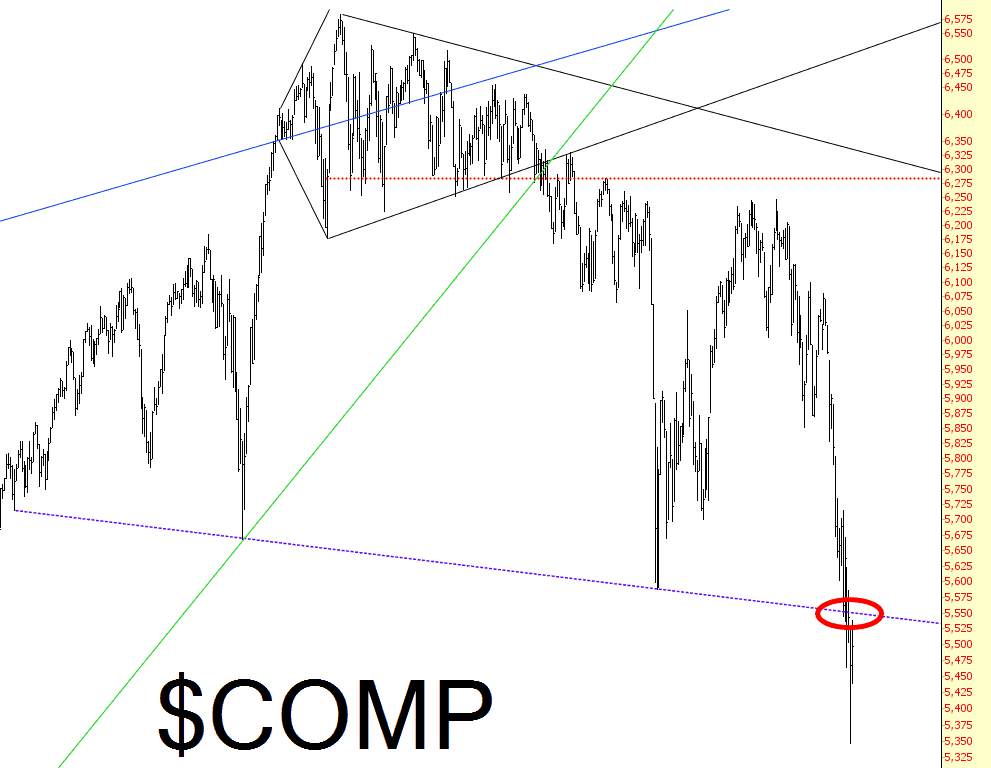
I want to make one simple but very important point, however. There may be bounces, sure – – maybe even a strong one or two. But the damage that has been done to the charts is massive, and a good hard look at the Dow Jones Composite, shown below, illustrates quite clearly that not only is the pattern complete, but the price action is beneath that pattern. I am more confident of my 1577 target on the S&P 500 this year than ever, and I think 2016 is going to be the best trading environment for chartists since 2008.

0121-comp

Canadian Dollar Points to Reversal in Crude

By -

One signal that Crude Oil could be putting in a significant low is being flashed by the Canadian Dollar, which has reversed from its plunge versus the Dollar.

Let’s notice on the lower chart that USD/CAD rocketed through its upper-channel boundary line one week ago, followed-through to the upside as Oil plunged beneath $30, but has reversed sharply (USD/CAD) from nearly 1.47 to 1.42 (CAD has strengthened)– and has pressed back inside of the upper-channel line… suggesting that Oil could be poised for a pop to $30-$31 in the upcoming hours.

full-y7L6lUvvTGEAWxazPcGeG

Originally published on MPTrader.com.

Tempo-Bull

By -

Well, I am a very patient bear (in case you didn’t figure that out, since I’ve been slogging it out from 2009-2015) but a very impatient bull. I bought a bunch of longs yesterday, including sizably big positions in XOP, XME, FXI, EEM, and others. They all did great today – – every single one with a profit, and some of the profits quite large. But I looked at this chart………

0121-XOP

And there were two very clear things:

(1) I think we can all agree that this is what we call a “downtrend”;

(2) The sensational bump higher today was getting awfully close to filling its gap

So, at the risk of missing out on a ton of bullish profits, I am “pure bear” again – – although LIGHTLY so (way more than half my portfolio is in boring old cash).