Slope of Hope Blog Posts

Slope initially began as a blog, so this is where most of the website’s content resides. Here we have tens of thousands of posts dating back over a decade. These are listed in reverse chronological order. Click on any category icon below to see posts tagged with that particular subject, or click on a word in the category cloud on the right side of the screen for more specific choices.

The H&S on NDX

By -

On the last big move up on equities the main and, almost only, driver was Tech. That has ended for the time being and, since it ended, Tech has been leading the way down. For that reason I have mainly been looking at NDX for signs that this retracement might go lower.

In my premarket videos at theartofchart.net on Friday and Monday and Tuesday this week I was talking about the possibility that an H&S might form on NDX and NQ at the obvious big support level at the possible H&S neckline close to the monthly pivot. Support was found there and since then a decent looking right shoulder for that H&S has been forming. I gave the ideal right shoulder high in the 20,000 area, and NDX reached 19904.50, which is close enough for a decent looking pattern. This morning that H&S on NDX broke down with a target in the 18250 area.

(more…)
Pennant or Peril?

By -

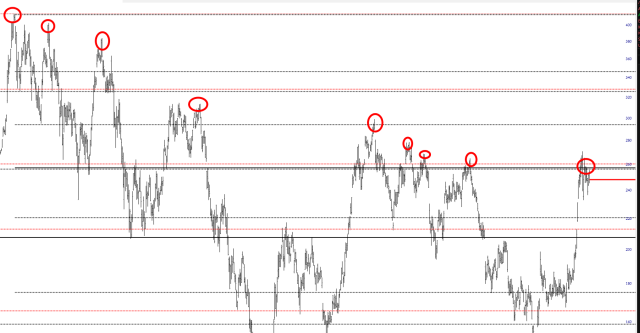
Tesla reports after the close today. I am typing these words about two hours before then, so by the time you read this, you’ll probably already know what result of TSLA. Right up front I’ll say I have no dog in this fight. Whether it goes up or down matters not to me. Indeed, I’d PREFER it go to up, for reasons some of you know. My Dumb Guess ™ though is that it’s going to sink, based on its long series of lower highs.

(more…)

Bitcoin Approaching Bull Flag Resistance

By -

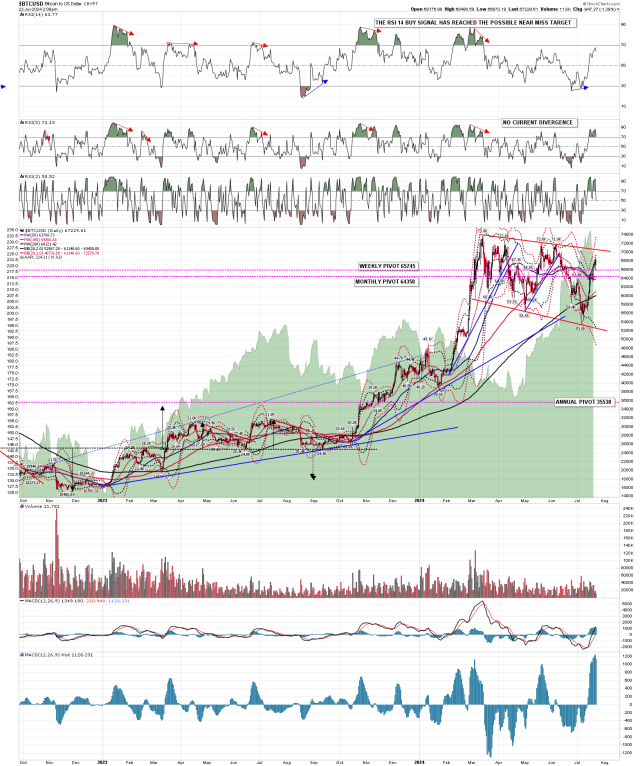
I called a possible swing low on cryptos on 5th July, and that’s been progressing as expected so far, and BTCUSD (Bitcoin) is getting close to bull flag resistance.

Bear flag resistance on Bitcoin is in the 70,600 area, and that is now getting close. If that breaks then the flag target will be a retest of the all time high at 73.8k. If Bitcoin continues to stay close to the daily upper band, then that should be hitting bull flag resistance by Wednesday.

BTCUSD daily chart:

(more…)

The Utility Fish

By -

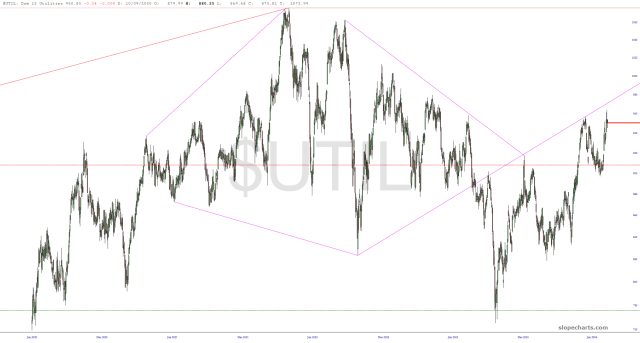
This isn’t the first time we’ve seen the peculiar “Ichthus” pattern (it’s not real; I made it up back in 2015) on financial charts, and here it is again on the Dow 15 Utilities. I’ve sort of given up on the $UTIL behaving itself properly, but I still find this fishy pattern to be fascinating, so long as it continues to respect the trendlines which comprise it.

Reaching Initial Target Level on Solana

By -

I called a possible swing low on cryptos on 5th July, and that’s been progressing as expected so far, and is getting close to some key resistance levels and, in the case of SOLUSD (Solana), is hitting it.

On BTCUSD (Bitcoin) the daily RSI 14 buy signal is reaching the possible near miss target area, and a possible daily RSI 5 sell signal is brewing. Bitcoin has broken back over the 50dma and converted that to support and the obvious next resistance is the bear flag megaphone resistance currently in the 70,800 area. A break above that opens a retest of the all time high at 73.8k.

(more…)