
I called a possible swing low on cryptos on 5th July, and that’s been progressing as expected so far, and is getting close to some key resistance levels and, in the case of SOLUSD (Solana), is hitting it.
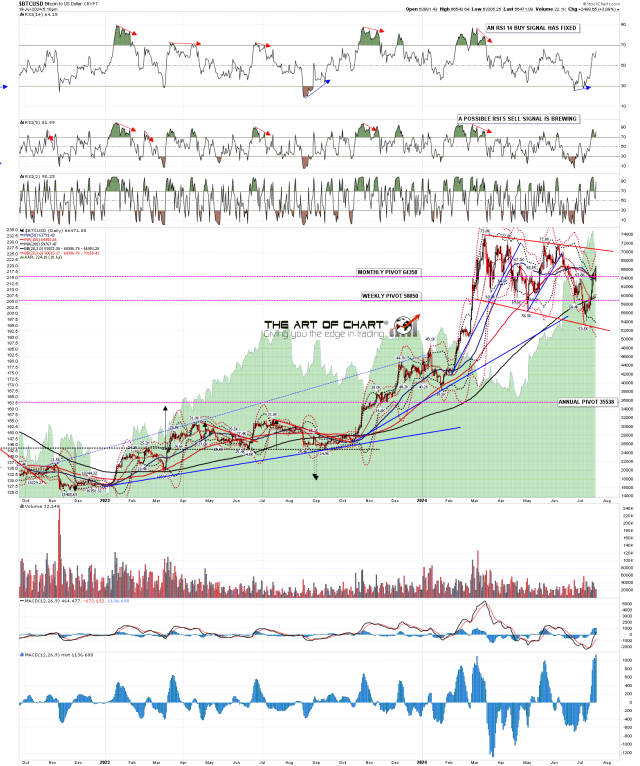
On BTCUSD (Bitcoin) the daily RSI 14 buy signal is reaching the possible near miss target area, and a possible daily RSI 5 sell signal is brewing. Bitcoin has broken back over the 50dma and converted that to support and the obvious next resistance is the bear flag megaphone resistance currently in the 70,800 area. A break above that opens a retest of the all time high at 73.8k.
BTCUSD daily chart:
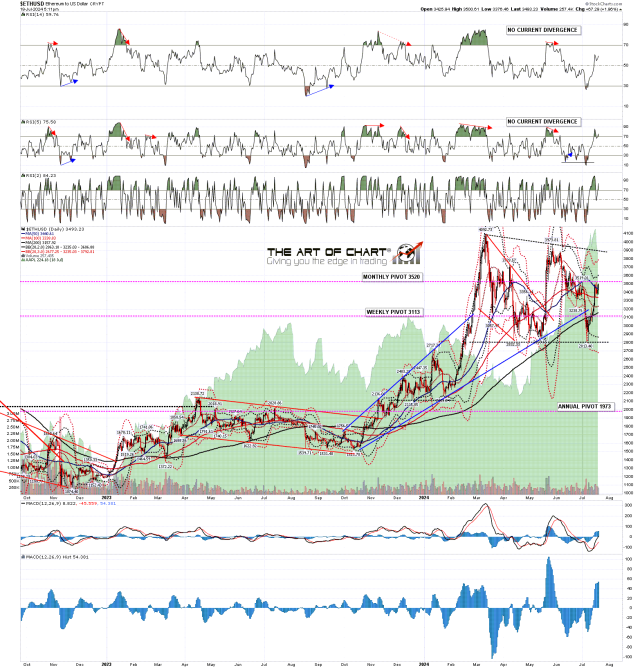
ETHUSD (Ethereum) has now broken back over the 50dma, and the way looks clear to the next obvious target at bull flag descending triangle resistance currently in the 3900 area. A break above would open a retest of the 2024 high at 4092.73.
ETHUSD daily chart:
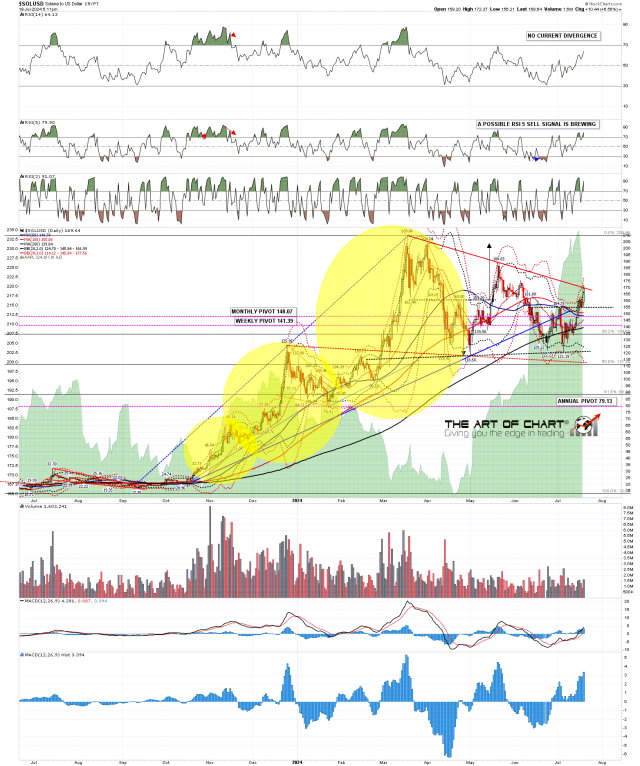
Solana was the one closest to bull flag/triangle resistance and that was hit today. Solana is close to the 3sd daily upper band and that may well deliver some consolidation in this area. On a break above Solana will have a double bottom target in the 188 area, and a bull flag target at a retest of the 2024 high at 209.86.
SOLUSD daily chart:
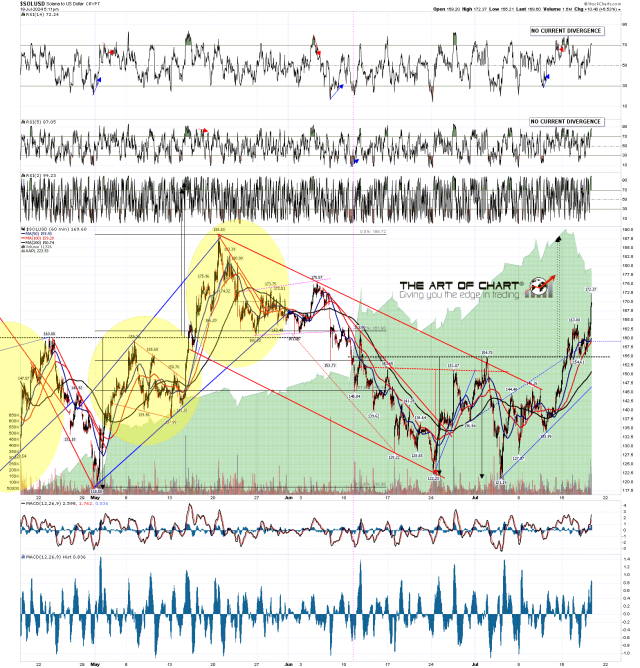
On the hourly chart Solana is now over halfway from the break of double bottom resistance at 154.78 to the double bottom target at 188. No current RSI divergence and nothing currently suggesting a significant reversal here.
Overall the crypto move up from the low is proceeding as it should if a significant swing low was put in two weeks ago, and in the my view the odds are decent that all three of the ones I have looked at today are on the way back to new all time highs.
SOLUSD hourly chart:
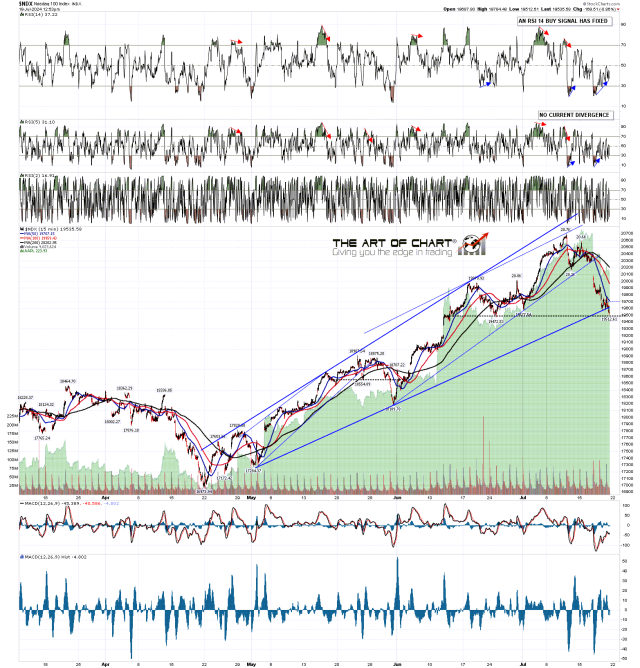
One chart on equities today to follow up on my post yesterday. The retracement scenario is proceeding well, but there is a strong chance that there may be a decent rally here and, if so, that a right shoulder may be forming on NDX and NQ setting up an extension lower. after the bounce.
I’m showing the possible H&S neckline hit on the NDX 15min chart below. Both NDX and NQ are testing their monthly pivots, so this is a big support level, and there are hourly buy signals fixed on NQ and ES, an 15min RSI 14 buy signal fixed on NDX and another brewing on SPX. We’ll see how that goes.
NDX 15min chart:
Everyone have a great weekend 🙂
