
On the last big move up on equities the main and, almost only, driver was Tech. That has ended for the time being and, since it ended, Tech has been leading the way down. For that reason I have mainly been looking at NDX for signs that this retracement might go lower.
In my premarket videos at theartofchart.net on Friday and Monday and Tuesday this week I was talking about the possibility that an H&S might form on NDX and NQ at the obvious big support level at the possible H&S neckline close to the monthly pivot. Support was found there and since then a decent looking right shoulder for that H&S has been forming. I gave the ideal right shoulder high in the 20,000 area, and NDX reached 19904.50, which is close enough for a decent looking pattern. This morning that H&S on NDX broke down with a target in the 18250 area.
NDX 15min chart:
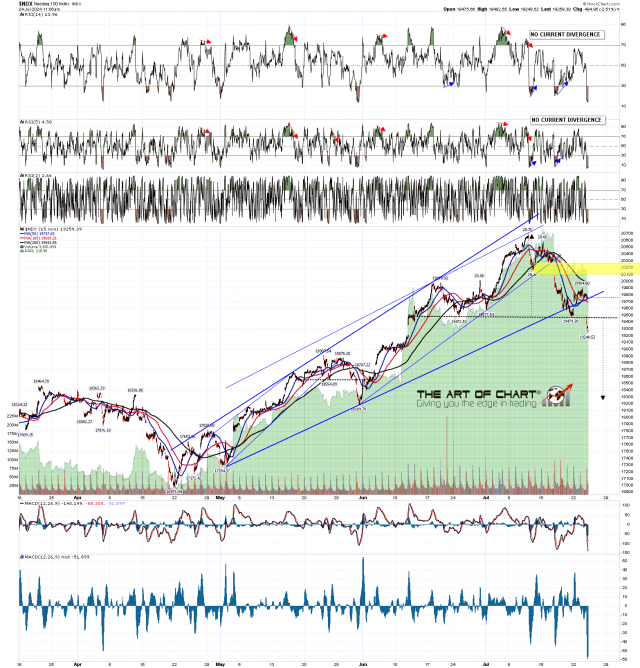
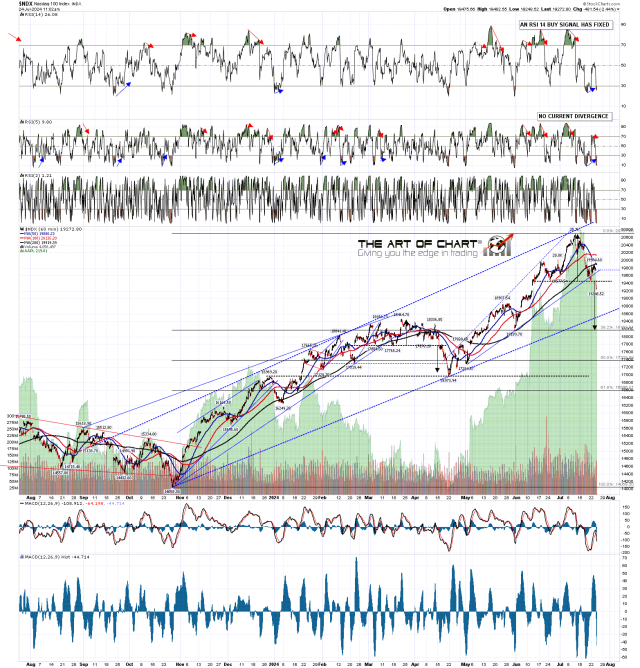
On the NDX hourly chart there is still a fixed RSI 14 buy signal which has not come close to target. That raises a question about another possible reversal back up, but overall the setup here is leaning towards the downside target. I’d note also that the H&S target is at the 38.2% fib retracement of the move up from the Oct 2023 low.
NDX 60min chart:
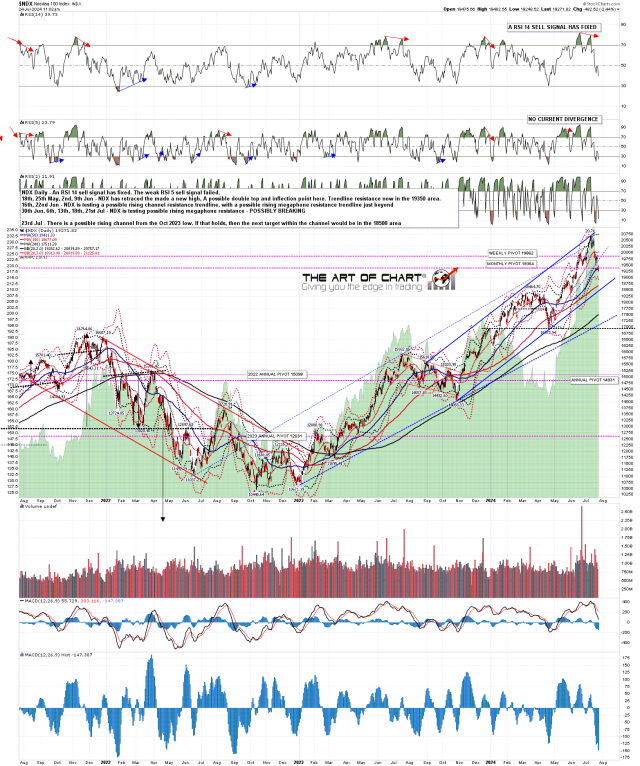
On the daily chart the rally on NDX was the weakest of the main US indices during the rally from Friday’s low, and this morning NDX broke down below the H&S neckline and the monthly pivot at 19,364. The monthly pivot is the key here. A break and conversion of the monthly pivot to resistance should deliver the H&S target area in the 18,250 area, with possible support on the way at rising support from the Oct 2023 low, currently in the 18,500 area.
NDX daily chart:
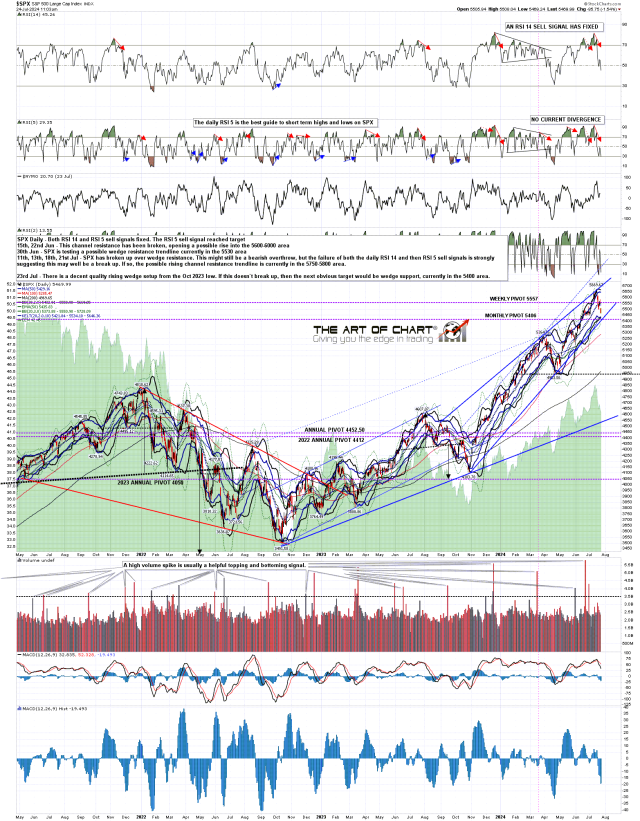
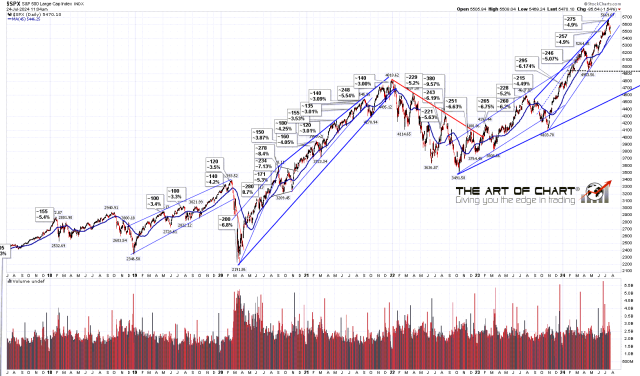
On SPX there is possible double support I’ll be watching at the monthly pivot at 5406 and rising support from the Oct 2023 low, currently in the 5400 area. If hit SPX may well find support there.
SPX daily chart:
On the SPX daily 45dma chart, this may well be a reversion to the mean move, and the mean I am using is the 45dma. that’s currently in the 5470 area, but tends to be a rough target, so I’d be expecting that to break on the way to bigger support in the 5400-10 area.
SPX daily 45dma chart:
Equities could be making a serious high here, though I’m skeptical about that and, if that is the case, it will likely involve at least one more high retest. In the meantime I’m looking for more downside, and we’ll see what happens when SPX and NDX start hitting the next big support levels.
