
I called a possible swing low on cryptos on 5th July, and that’s been progressing as expected so far, and BTCUSD (Bitcoin) is getting close to bull flag resistance.
Bear flag resistance on Bitcoin is in the 70,600 area, and that is now getting close. If that breaks then the flag target will be a retest of the all time high at 73.8k. If Bitcoin continues to stay close to the daily upper band, then that should be hitting bull flag resistance by Wednesday.
BTCUSD daily chart:
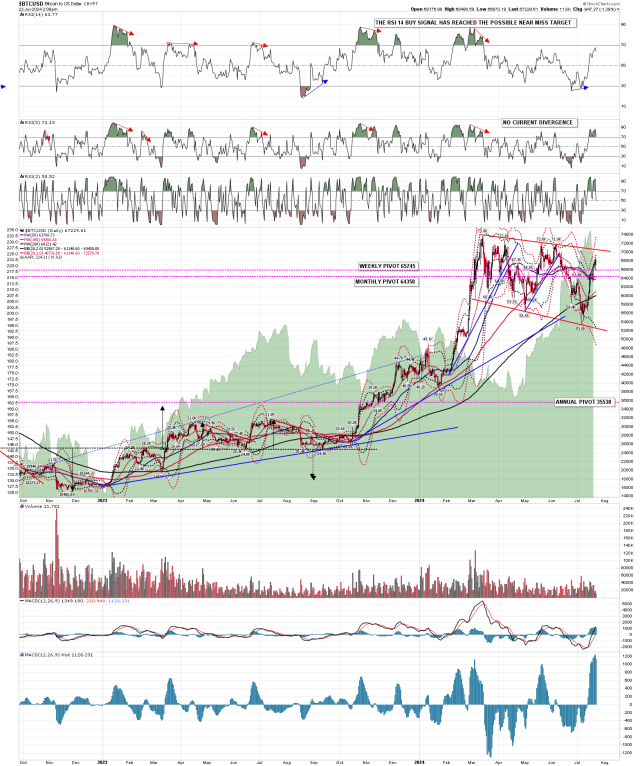
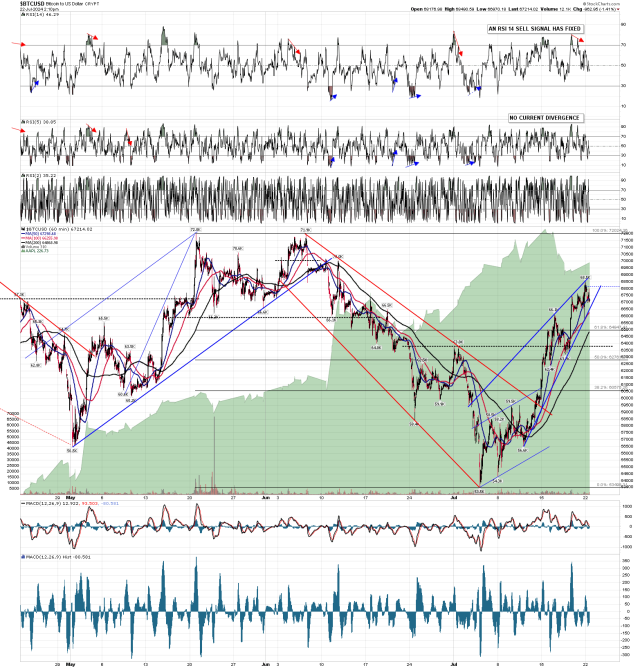
In the short term there is an hourly RSI 14 sell signal fixed on Bitcoin, short term trendline support is in the 66,700 area, the new weekly pivot is at 65,745, and there should be decent double support at the 100dma at 64,364, and the 50dma at 63,784. If that fails then the next double support is at the daily middle band at 61,136, and the 200dma at 60,120. A break below 60,000 at this point would be worryingly bearish.
BTCUSD hourly chart:
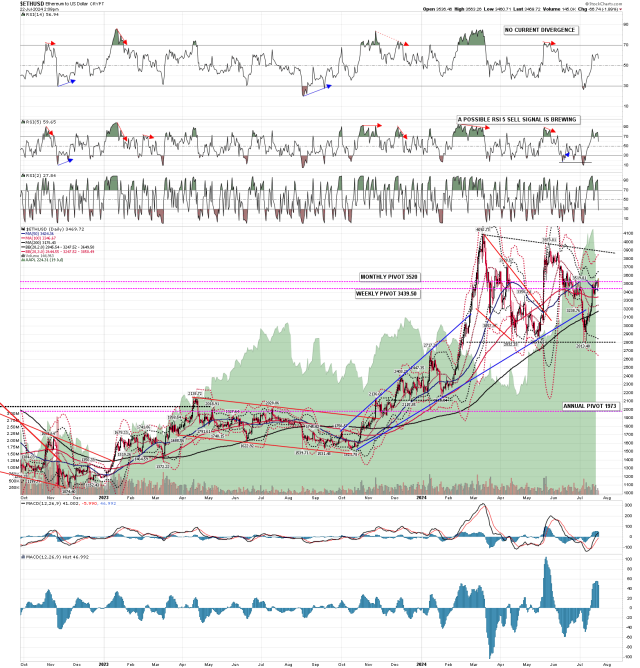
On ETHUSD (Ethereum), the bull flag resistance in the 3.890 area is further away and there is a possible daily RSI 5 sell signal brewing. Ethereum is currently backtesting the new weekly pivot at 3439.50, and is close to a backtest of the 50dma at 3423. Main support is at the daily middle band, now at 3246, and once again, a sustained break below that would be bearish.
ETHUSD daily chart:
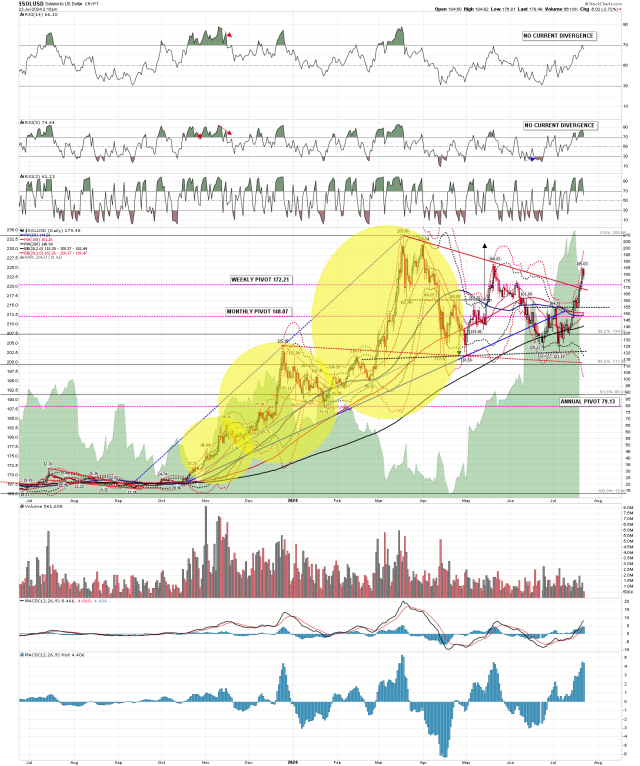
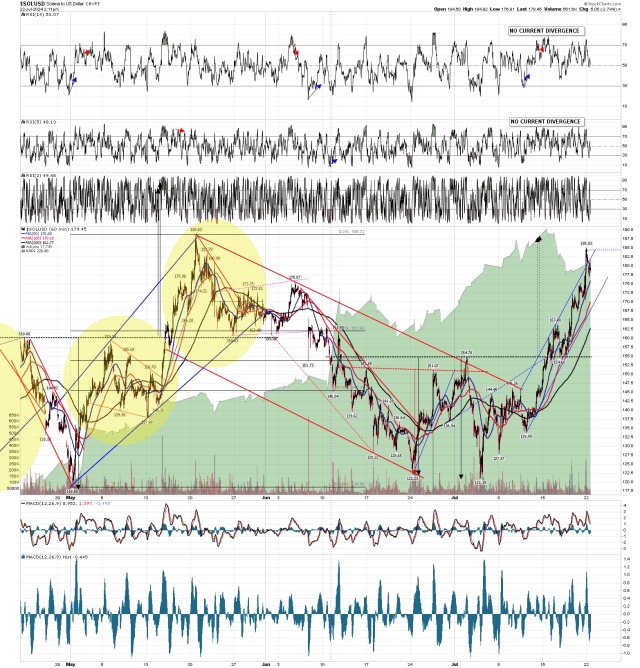
SOLUSD (Solana) has already broken back well above the obvious bull flag resistance, and has a still unconfirmed target back at a retest of the 2024 high at 209.86. On a sustained break back over the May high at 188.83, I would consider that 209.86 bull flag target confirmed.
I mentioned last week that Solana was close to the daily 3sd upper band, and that would be a good time to see some consolidation, and we may be seeing that at the moment. First support is at the new weekly pivot at 172.21, and no obvious big support levels below that until the 150 area, with all of the daily middle band, and the 50dma and 100dma currently in that area. I would be surprised to see that area tested at this stage and a sustained break below would look very bearish.
SOLUSD daily chart:
On the Solana hourly chart the double bottom target in the 188 area has almost been reached with a high at 185.03 over the weekend, and once that target is made I’d be looking for a test of the May high at 188.83. On a sustained break above that I would be looking for a retest of the 2024 high at 209.86.
SOLUSD hourly chart:
Overall the bull setup on these cryptos is looking good, and in my view there is a decent chance that all three are on the way to retests of their all time highs over coming weeks and months, with that closest on Bitcoin, and still some distance away on Ethereum and Solana. launches of spot (rather than futures based) ETFs on Ethereum and Solana would help that a lot, and we may be seeing both approved and launched in coming months.
