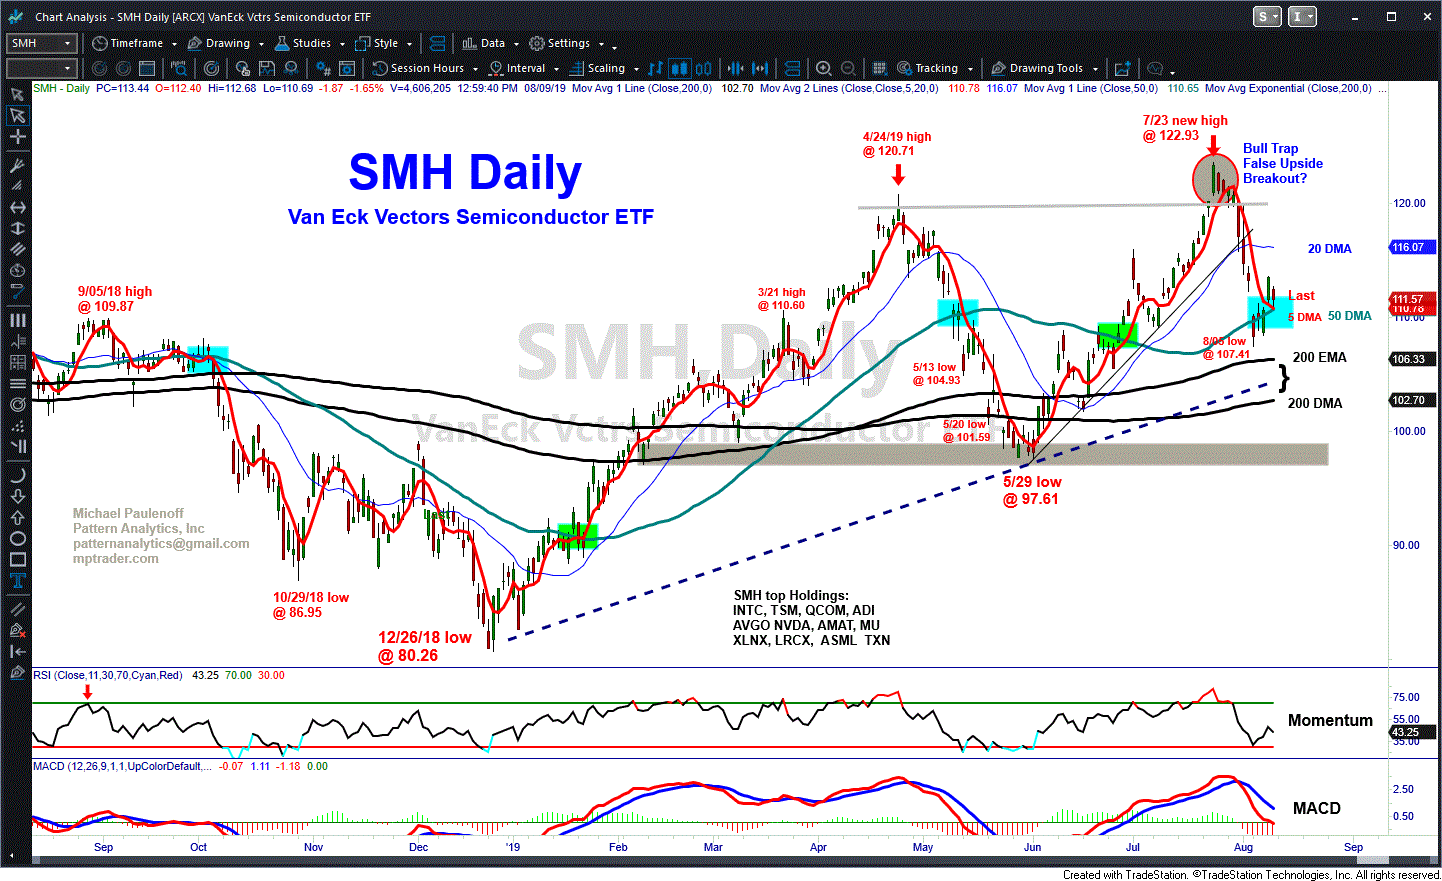
The VanEck Vectors Semiconductor ETF (SMH) has a fascinating big-picture chart set-up that is loaded with technical information, most of which argues for more downside directly ahead.

Slope initially began as a blog, so this is where most of the website’s content resides. Here we have tens of thousands of posts dating back over a decade. These are listed in reverse chronological order. Click on any category icon below to see posts tagged with that particular subject, or click on a word in the category cloud on the right side of the screen for more specific choices.
The VanEck Vectors Semiconductor ETF (SMH) has a fascinating big-picture chart set-up that is loaded with technical information, most of which argues for more downside directly ahead.

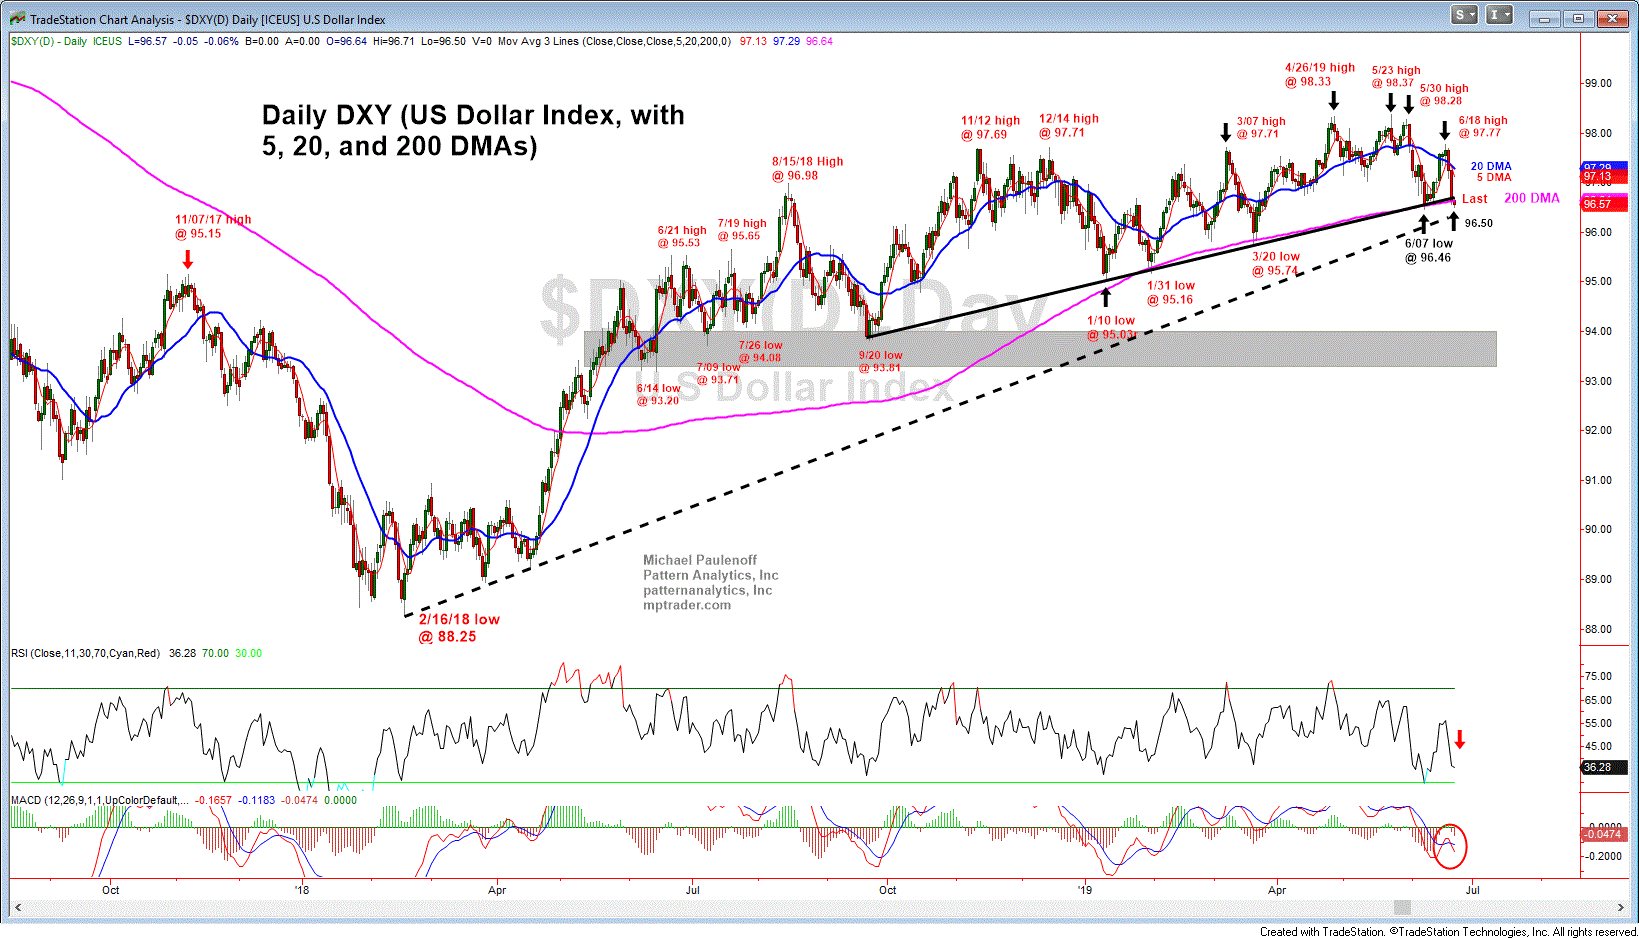
The U.S. Dollar Index (DXY) is worth watching closely today, with important implications for Gold.

After performance results for the record books in the first quarter of 2019, the stock market is entering a very challenging period in April.
To be sure, the success and presumed benefit from a US-China Trade Deal remains a big economic and geopolitical carrot stick for the markets in the days ahead. How much of the anticipated trade deal dividend already has been discounted by the impressive Q1 gains is anyone’s guess at this point. Certainly, both the adjustment of the Fed’s interest rate trajectory and the prospect of renewed growth once the trade dispute is resolved combined to support the market during Q1.
(more…)Is the S&P 500 (SPX) on the verge of a sustained upside breakout as it pushes through multiple prior failed rally peaks just above 2800? This week should provide some answers.
Actually, a sustained climb above 2832 (on a closing basis) also will answer the question we have been asking in these weekly articles for the past four weeks: Will the powerful advance from the Dec 26 low at 2346.58 be stymied in the 2775 to 2832 resistance zone?
This zone is the area that measures 76.4% of the entire prior Sep-Dec correction — what we’re calling the “Fibonacci Recovery Price Resistance Zone” — and in the last 20 trading days the SPX has probed but failed to hurdle the upper boundary (2832) of this zone no less than five times!
(more…)In last weekend’s article, we focused on the relentlessly advancing S&P 500 (SPX) from its December 26 low at 2346.58 into an important Fibonacci price and time resistance zone at 2713.70 on January 31.
The 2713.70 level represented a 62% SPX recovery of the entire September-December decline, while January 31 represented day number 89 since the September 2018 all-time high, and the day that the December-January recovery rally time period equaled 38% of the overarching total timeframe from the September high.
We discussed the likelihood that the confluence of such meaningful Fibonacci price and time relationships could and should stall or reverse the relentless SPX six-week advance, and as such, would be a yellow caution flag for the bulls. (more…)