Slope of Hope Blog Posts

Slope initially began as a blog, so this is where most of the website’s content resides. Here we have tens of thousands of posts dating back over a decade. These are listed in reverse chronological order. Click on any category icon below to see posts tagged with that particular subject, or click on a word in the category cloud on the right side of the screen for more specific choices.

China’s Shanghai Index: The Falling Knife

By -

Further to my post of June 8th, here’s what has happened, since then, on China’s Shanghai Index.

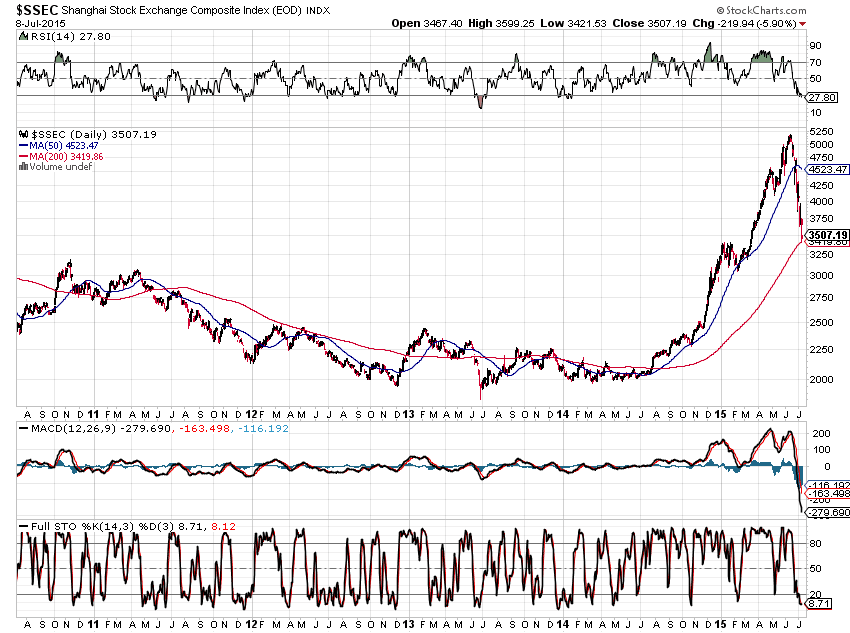
After making a slightly higher high of 5178.19 on June 11th, it has since plunged to a low today (July 8th) of 3421.53 to close at 3507.19…slightly above its 200 Day Moving Average — making a loss of 1671 points from high to close, thus far.

The first level of major supports sits around 3000…the next around 2500…a solid break and hold below 2000 could cause major panic in markets around the world.

So far, attempts by the Chinese Central Bank to intervene and stop this falling knife have failed…we’ll see if this market can find any stability at any of the above-noted levels. There are no “buy” signals at this time on the RSI, MACD, and Stochastics indicators — rather, they are still bearish, although quite oversold; however, the extreme bearish force of the MACD, in particular, should be respected, as we could, very well, see much more selling in the short term.

SPX Candle Review of the First Half of 2015

By -

Q2 of 2015 closed today (Tuesday, June 30th). The following describes candle action, to date, in four timeframes — namely, Yearly, Quarterly, Monthly, and Weekly timeframes.

Each candle shown on the following chart of the SPX represents One Year.

The first half of this year is depicted by a “doji,” as of the close on June 30th — spelling “indecision” by this equity market. So far, the close is a mere 4.21 points higher than its open on January 2nd…not much of a gain in six months…no surprise, since price has been held back by the 161.8% External Fibonacci Retracement level (taken from the last major swing high in 2007 to the 2009 low), which is a typical major Fibonacci profit-taking level.

Each candle on this next chart of the SPX represents One Quarter of One Year. (more…)

Bull/Bear Struggle for Control of EUR/USD

By -

The following Monthly chart of EUR/USD Forex pair shows that price has been bouncing (generally) between 1.15 (dotted yellow horizontal line) and 1.08 (solid yellow horizontal line) since February of this year.

At the moment, 1.15 is defined by a confluence of a Fibonacci fanline and a falling trendline…1.08 sits around the lower one-third level of the large price range between the 2000 lows and the 2008 highs.

(more…)

Fibonacci Resistance Levels on S&P 500 E-mini Futures

By -

Depicted on the Weekly chart below of the S&P 500 E-mini Futures Index (ES), are two External Fibonacci Retracements, a Fibonacci Extension, and a channel.

There are two upcoming levels of confluence representing major resistance:

  • the first is between 2139 and 2155 (which could be hit any day now)
  • the second is between 2213 and 2216 (which could be hit around July 20th if this extreme bull run continues in an aggressive, sustained momentum)

I’d watch for any aggressive drop below 2070 to signal a possible re-test of the bottom of the channel around the 1980 level, or even lower (I’d watch for general signs of weakness in the Dow Jones Composite Index — as noted in my post of June 20th — as confirmation)…otherwise, if price holds above 2070, we could very well see the second target resistance level hit by July 20th.