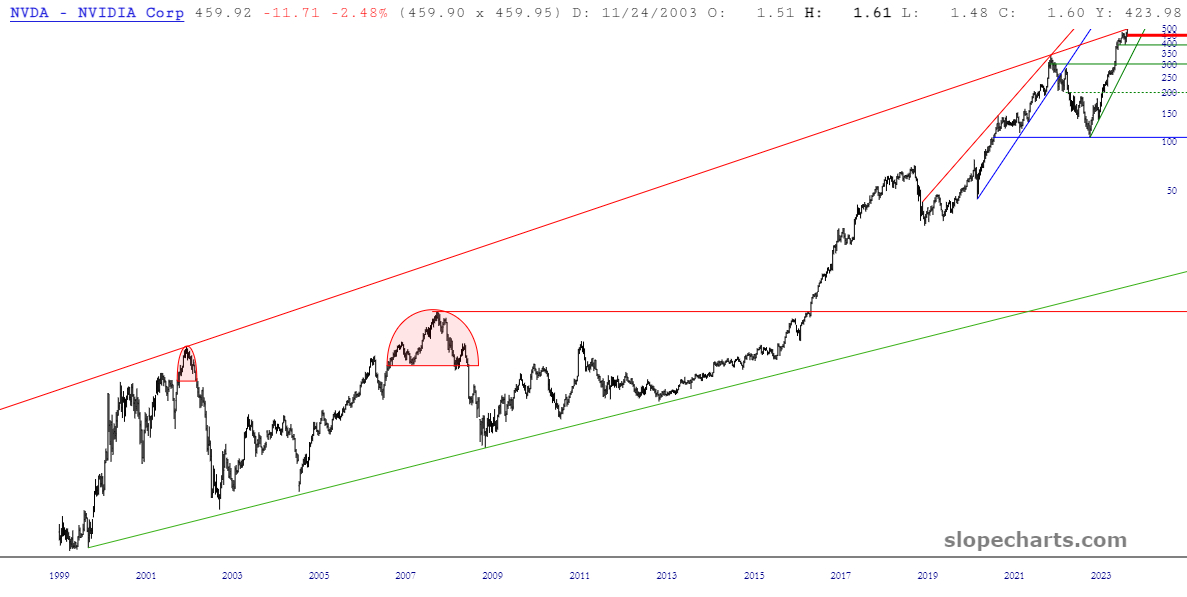
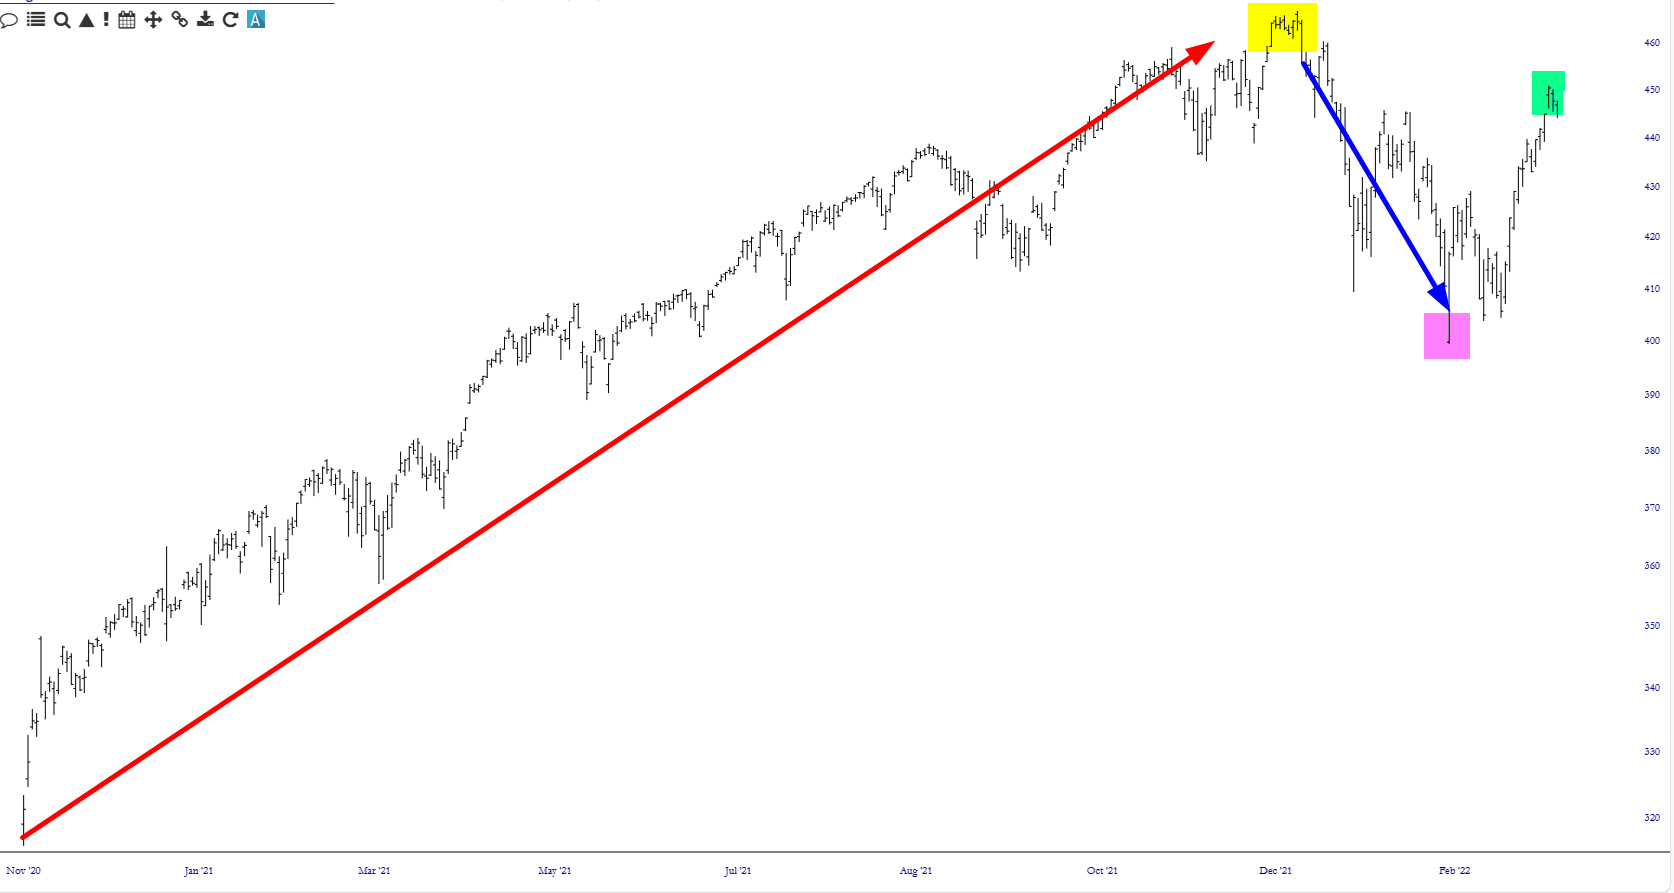
Here’s a fun item I stumbled upon while thumbing through charts this weekend. Take a look at the daily SPY chart below, which is from late in 2021 into early 2022.
Slope initially began as a blog, so this is where most of the website’s content resides. Here we have tens of thousands of posts dating back over a decade. These are listed in reverse chronological order. Click on any category icon below to see posts tagged with that particular subject, or click on a word in the category cloud on the right side of the screen for more specific choices.
Here’s a fun item I stumbled upon while thumbing through charts this weekend. Take a look at the daily SPY chart below, which is from late in 2021 into early 2022.
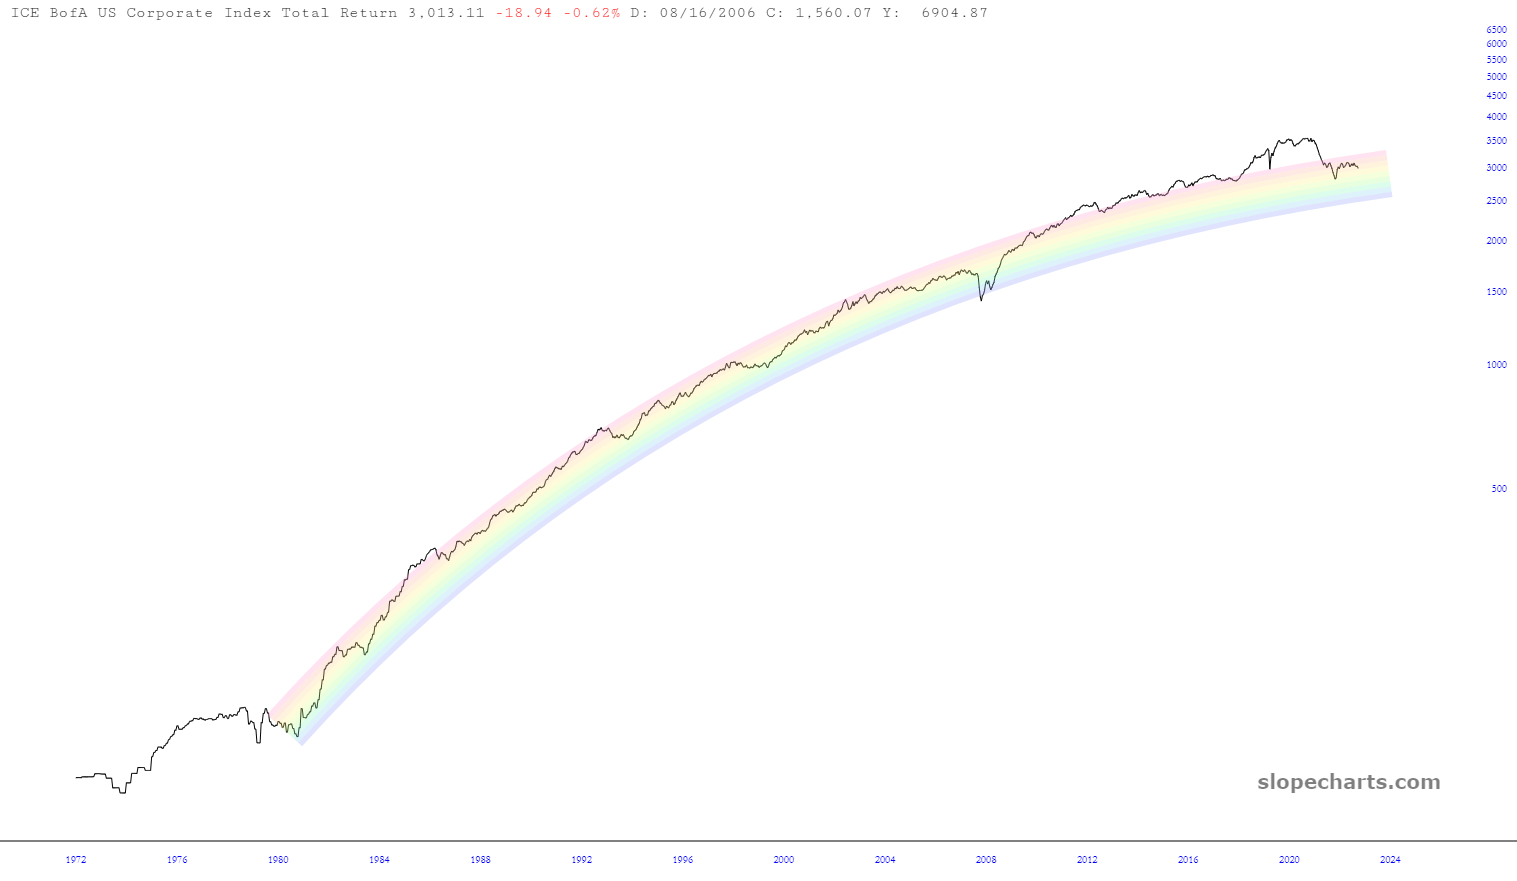
Here is the long-term corporate bond total return index. Bonds perform well, but they start losing steam in the 2010s as interest rates are suppressed. The Fed slashed rates into 2020, then spiked them. Investors holding corporate bonds lost all profits back to 2016 at the 2022 low.
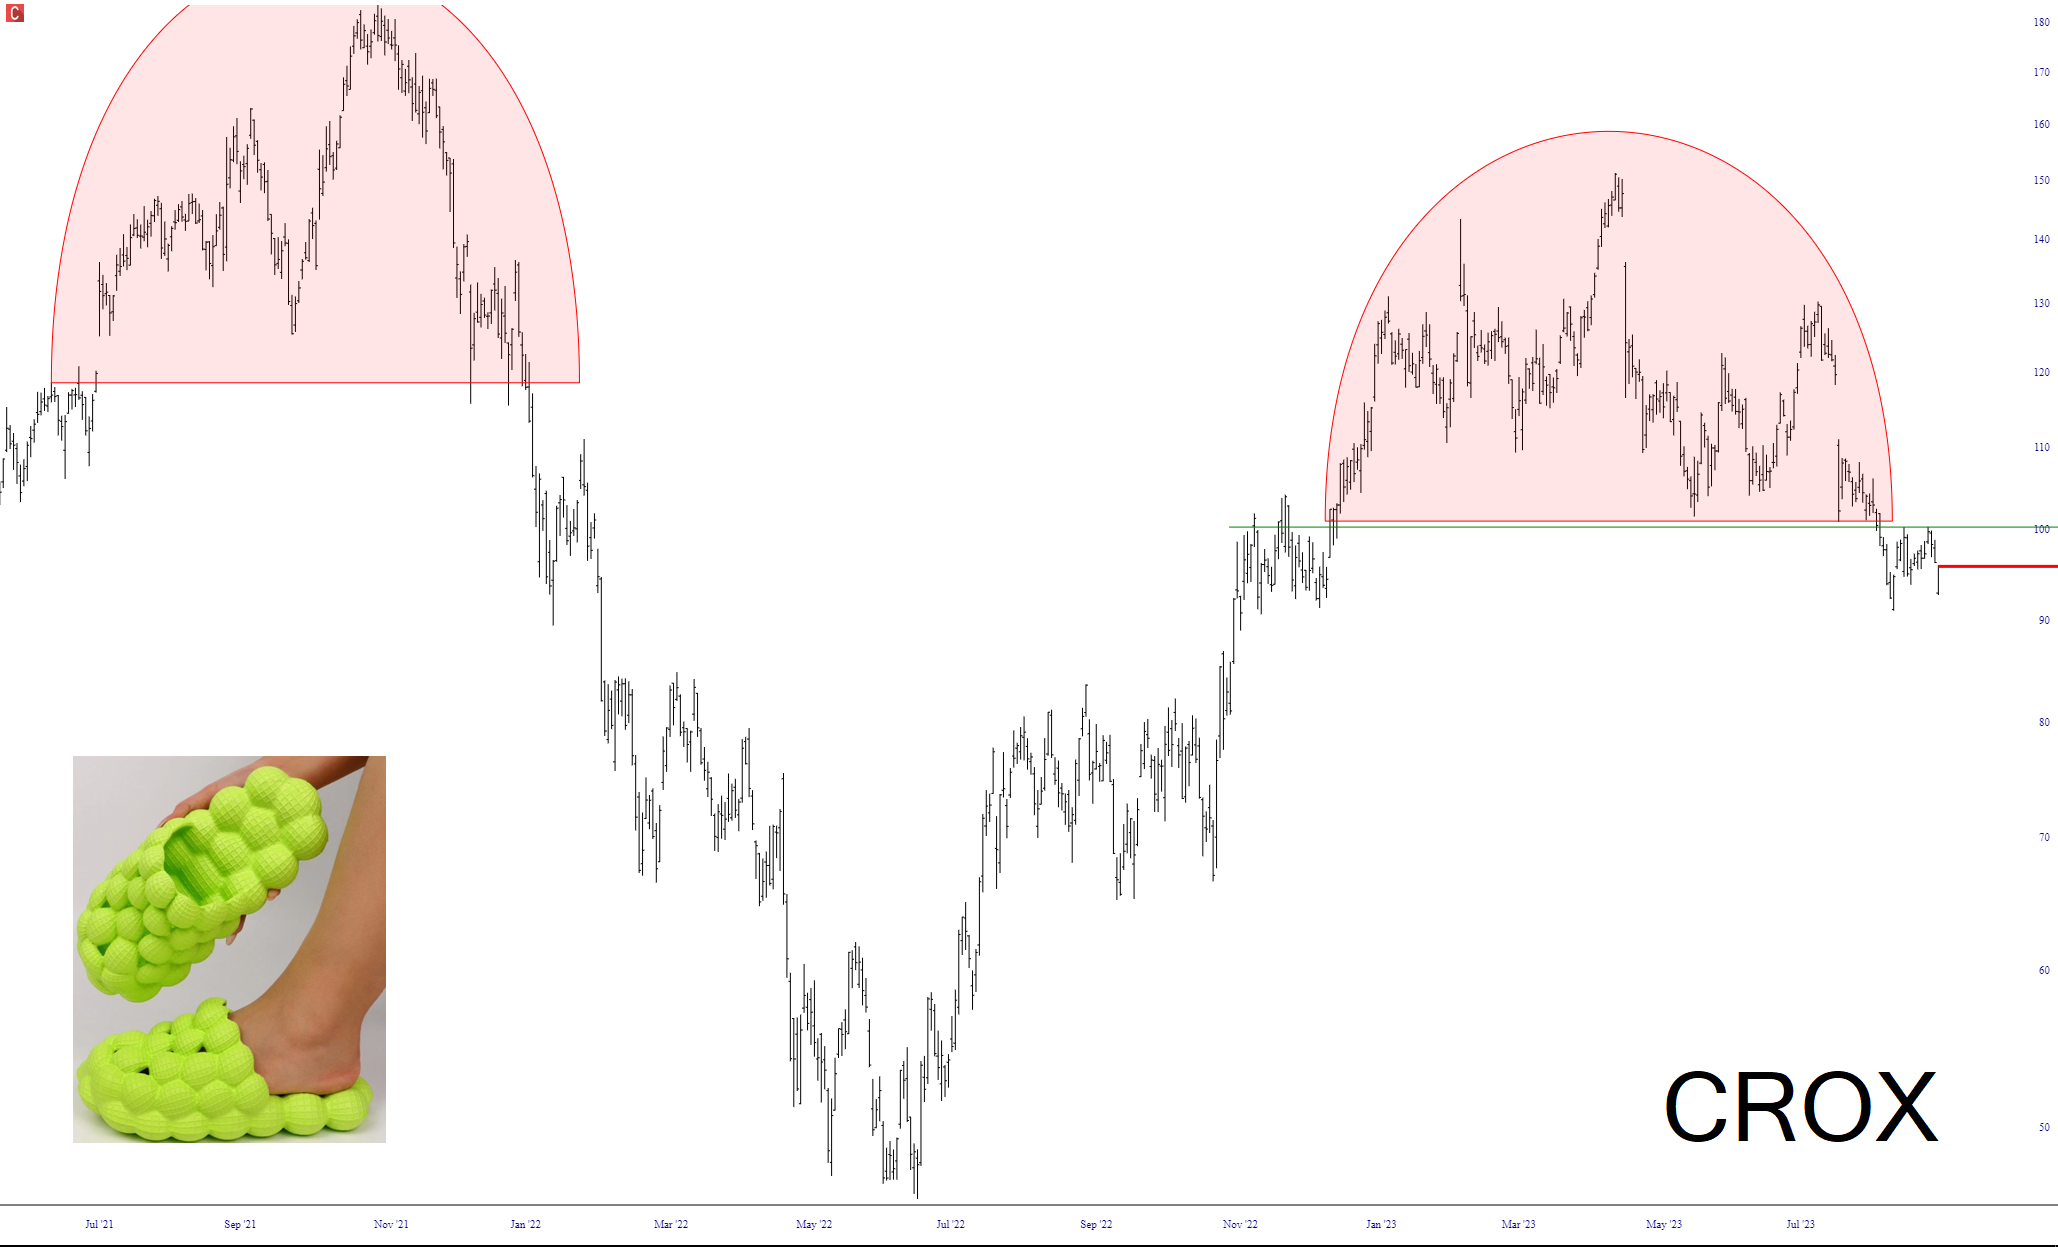
I have bought January 19 2024 $115 puts on CROX, the maker of sensationally fashionable and tasteful footwear. I am compelled by this well-formed analog with its fast tumble. Good luck!
By this point, even native tribesmen in the deepest reaches of the Amazon rain forest know the chart below and how it got where it is today.