
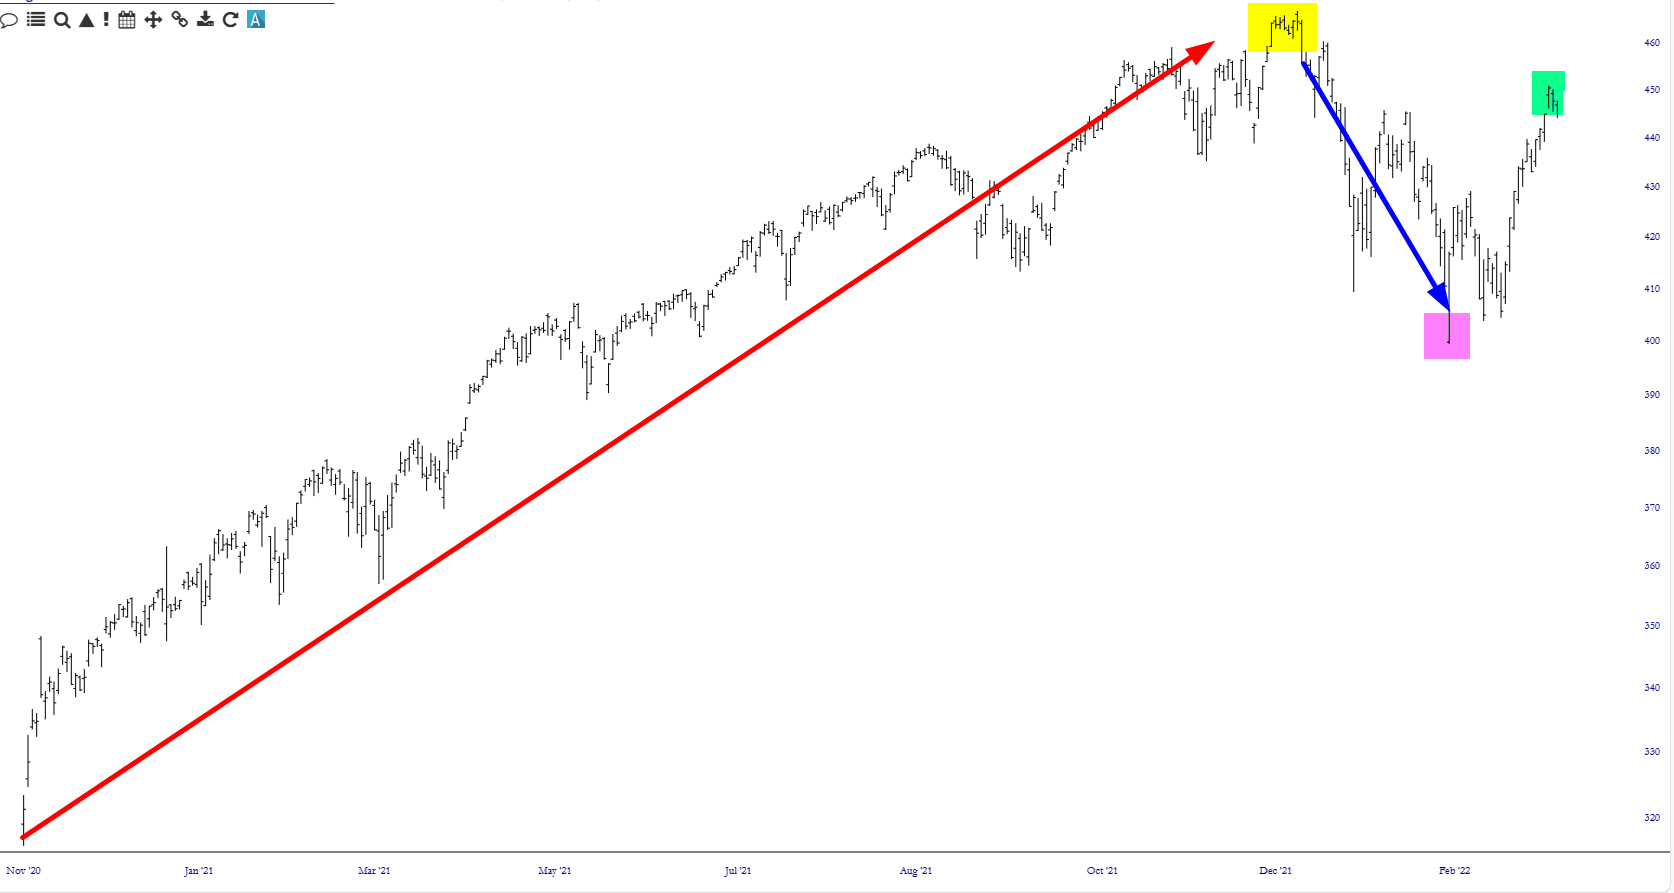
Here’s a fun item I stumbled upon while thumbing through charts this weekend. Take a look at the daily SPY chart below, which is from late in 2021 into early 2022.
Below it may look like I’ve simply repeated the exact same chart, but I haven’t. This one represents the past year instead.
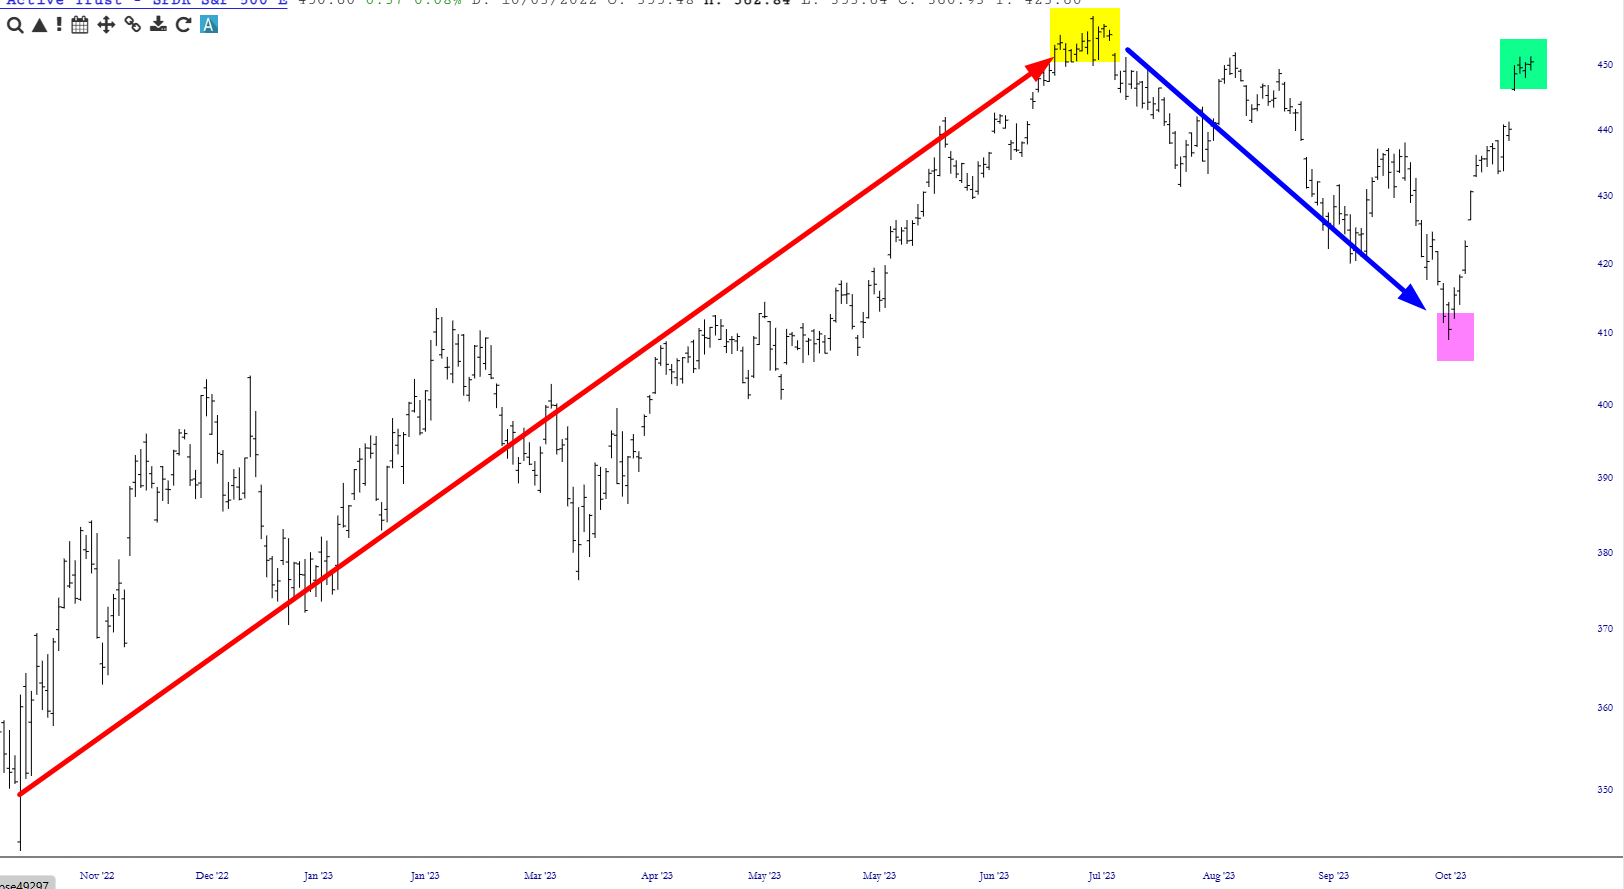
In each case we see:
- A powerful ascent, the red arrow, to a peak, tinted in yellow;
- A steady reversal of lower lows and lower highs, the b
- A bottom, tinted in magenta;
- A powerful bounce higher, almost but not quite as high as the prior peak, which is tinted in green
So what happened following the green tint in 2022? Well, thoughtful host that I am, I have provided you this answer by way of this red circle:
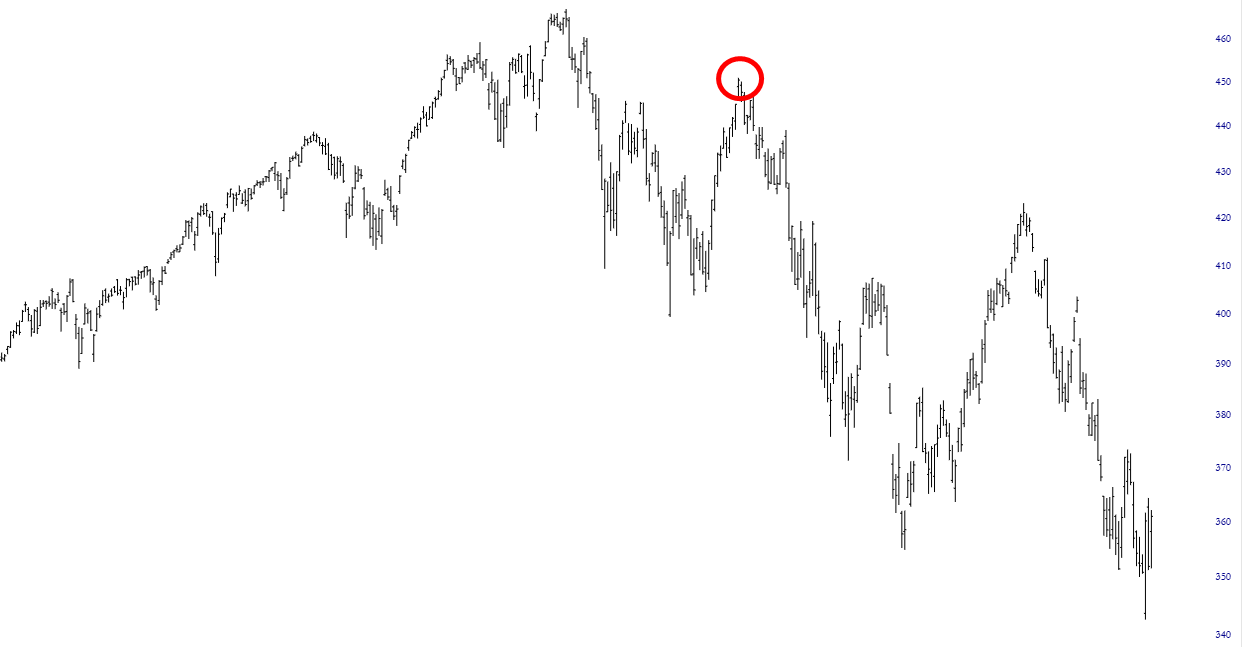
In other words, if this is a “You Are Here” moment, then being a bear may stop sucking very soon.
