The trendlines on equities look less boring today. As I often say, you need a counter-trend move to deliver trendlines and yesterday's high delivered a very nice declining channel on ES from the high. Later on yesterday's low also delivered a decent rising channel from the low. I have the channel breakout levels at 1305 and 1320 and a breakout in either direction should give the direction of the next significant move. If 1305 is broken there is a significant possibility that we could see a double-bottom made in the 1295 area:

TF has now also developed a decent quality declining channel. The upper trendline of the declining channel has three hits and a break up through it would look very significant:

The declining channel on NQ is of lower quality, but I'd like to consider a larger pattern that may be forming there, and that is the possible cup with handle. I was writing at the start of last week that the possible cups with handles that were being talked then about were of poor quality, but that is not the case with this NQ pattern at all. Cup with handle patterns should include the following:
- Price trend – upward leading to the pattern. Price should rise by at least 30% leading to the cup
- Shape – A U-shaped not V-shaped turn that looks like a cup with a handle on the right
- Cup duration – from 7 to 65 weeks
- Handle duration – 1 week minimum but usually 1 to 2 weeks
- Handle – forms in upper half of cup
- Cup – cup ruims should be near the same price level
- Continuations – patterns that act as continuations of the prioce trend substantially outperform those acting as reversals
- Warning – price tends to rise 10% to 15% and then reverse downwards. Sell quickly or you may take a loss.
These are from Bulkowski's excellent website and the page for these patterns is here. As you can see this NQ cup with handle would be close to a model formation for this pattern and it should be taken very seriously indeed. We could see further retracement for the handle, but as the handle should be in the upper half of the pattern NQ would need to stay above 2298:

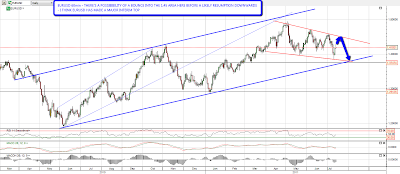
EURUSD recovered hard yesterday. I think EURUSD has made a major interim top but there's a possibility of a bounce into the 1.45 area looking at my daily chart:
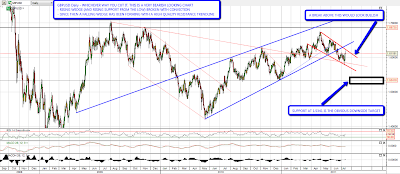
I haven't done a GBPUSD chart in a few days so I thought I'd post one today. Obviously GBPUSD broke rising support from the low, and the rising wedge that was a part of, and that looks extremely bearish. However a smaller but decent quality falling wedge has developed from the last high, and I'm watching that carefully. If that breaks up then I'd be wondering about a retest of broken support in the 1.635 area:
I sometimes wonder whether many of the financial bloggers,including myself, have a sort of Stockholm Syndrome after seeing the equity bears beaten to death repeatedly by the Fed since March 2009. Obviously the bears are right that the economic fundamentals are in the toilet, and the thread holding up the huge sovereign bonds default sword, that will amost certainly end this bull market as and when, grows ever thinner. To an extent though, what's new? Anyone with a decent knowledge of economic history can see that this cyclical bull market is likely to end badly, but when? Until we see some really good evidence that the current government debt bubble is over, and that the bond market vigilantes have woken up from their long long sleep, then in my view the path of least resistance for equities is still up, and earnings are of course still improving, as they are likely to until the US starts to see real austerity measures taken to bring the budget deficit under control.
All that having been said, there are a couple of thought-provokingly bearish charts I'd like to finish with today. Here is a daily chart of the SPY, showing a 'Kiss of Death' retest of broken rising channel support from last summer:

The second chart is a fractal comparing recent months on SPX with the 2007 top from Zero Hedge. The resemblance is very striking I have to say:

If the Zero Hedge fractal is to play out, then we would need a trigger to tip the looming sovereign debt crisis over the edge, and a technical default from the US could provide that trigger if US lawmakers play chicken with the debt ceiling for too long. Something to watch for sure.
