Slope of Hope Blog Posts

Slope initially began as a blog, so this is where most of the website’s content resides. Here we have tens of thousands of posts dating back over a decade. These are listed in reverse chronological order. Click on any category icon below to see posts tagged with that particular subject, or click on a word in the category cloud on the right side of the screen for more specific choices.

Interesting Chart of Russell Ultra-Bull

By -

I noticed something kind of interesting this morning about the ultra-bull ETF for the Russell 2000. Take note of the horizontal line I've drawn, along with the touch-points. Before the crash (Tim's eyes grow misty and wistful..…..) UWM kept hitting this line, until it finally broke through gloriously on October 2, 2008.

Since the bottom, it climbed 300%, peaking on April 26, 2010 before slipping in a sustained downturn (remember those?). It has since clawed its way back up to this same line.

It seems accepted as gospel that stocks will never go down for more than one day again in our lifetimes, but I think this chart is worth noting.


1209-uwm

Major Breaks Up (by Springheel Jack)

By -

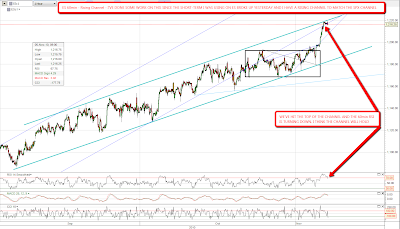
I love channels. They give structure to a trend. They deliver good entry and exit levels. They're dependable, though to be used with caution like any other technical analysis tool. The current SPX rising channel is of long enough duration, and steep enough, that it should contain the current wave up until we get confirmation that the wave has finished through the channel breaking down. I was therefore not at all happy to see that SPX closed slightly above the SPX rising channel yesterday:

If SPX had closed at the top of the channel rather than slightly above it I would very confidently be calling for a retracement today. As it is I think a retracement is still likely, but the odds of a further upside breakout have increased considerably. The rectangle target at 1220 SPX was made yesterday, so that at least is no longer in play.

My short term ES channel broke up yesterday and I've had a hard look at ES to determine the current structure there. We have an almost identical channel to the SPX channel on ES, and that channel has not broken up, with an exact touch at yesterday's high:

My slightly more cautious call for a retracement today therefore gives the following levels on ES:

  • 1220 – 1222 – Strong resistance at upper channel trendline
  • 1202 – 1204 – Retracement target at mid-channel line (and recently short-term channel upper trendline)
  • 1183 – 1185 – Strong support at the lower channel trendline

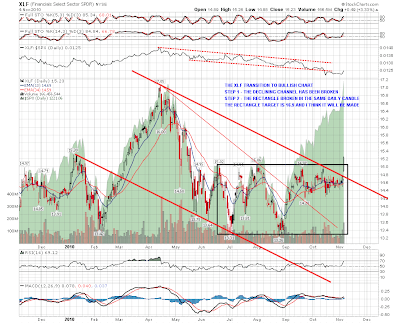
Longer term what was left of the technical bear case received another severe battering yesterday and to my eye there isn't much left. The SPX 200 SMA on the weekly chart was broken convincingly, which was powerful bull market confirmation, and one of the last hopes of the bears, that financials would drag the market down, was also largely demolished in a single dramatic daily candlestick yesterday. XLF managed to break both the declining channel from April and the rectangle in a single day yesterday, and the rectangle target is now 16.9, which looks undemanding given that is still below the April high:

USD has now finally broken triangle support, though there has not yet been a break on a weekly basis. We'll see if we get that today. I have a decent quality declining trendline on the daily chart that I posted yesterday but looking at the weekly chart, my next declining support trendline would be hit in the 60 area, which is (cough) something to think about:

The bears are complaining that this bull market is an artificial construct based on a huge and unsustainable wave of government borrowing. I agree completely, but I think that's missing the point. All bull markets in recent years have been wild moves up based on fantasy and fraud, and this current bull market is built on even finer sand than the last two. My long term view is that we're in a steep reversion to the mean declining channel from the first bubble in 1995 – 2000, and that this current bull market is simply a return to the top of that declining channel. Here's the long term chart of the SPX adjusted for CPI and you'll see what I mean:

Looking at that real terms SPX chart I'm getting an upside target for the current bull market in the 1450 area, and I think we're going to make it to that target. We won't make it there in a straight line, and after we reach it I'm expecting the current bull market to end with a bond crisis to end the current wave of government borrowing, and an equities bear market that will be consequently uninterrupted by keynesian interventions. Until that time we should just buckle up and enjoy the ride.

I did a post in August going through this scenario in some detail. The short term gartley pattern leg down I was looking at then didn't play out, but the rest of my projection for this bull market is still valid and you can see that here.

Gas Up with MLP’s (by BKudla)

By -

By nature, I am a trend guy.  I spent most of my corporate career looking at the future and divining trends.  I invest/trade the same way.  In the energy field, this country has only two good, domestic options in its energy future; natural gas and nuclear.  Nuclear has reached recognition stage and is now catching a bid, and I wrote on its bright future in prior posts.


Natural gas is still trying to balance supply and demand, and prices continue to fall on average. I view this as a cyclical problem and have already positioned myself accordingly with SJT and LINE.  Why? Contrary to popular media opinion, the Northern Hemisphere is in a cooling trend, this pressures stockpiles, Natural gas can be converted to Ag Chemicals which is going to start a major buying move as farmers have underapplied fertilizers to save money, now yields are suffering, a weak dollar will make oil less attractive against domestic Natural Gas, and the clean energy movement will force companies and utilities to move to natural gas.


Linn energy has already Tripled from my itial purchase price because they are astute hedgers and have more oil in their mix.  San Juan Basin is an American pure play, mostly Natural gas producer and is slowly rising every month.  A third player I am watching and now will start buying is PVX, Provident Energy out of Canada.  They produce and ship liquid natural gas. I like the chart, and it is looking at breaking out again. 


These MLP's pay between 6.5%-9.4% monthly distributed dividends, so I get paid on these while I await gas prices to catch a bid.


I buy a little each month (LINE have a full position) as the RSI7 comes off the bottom.

www.arum-geld-gold.blogspot.com


Onward and Upward (by Springheel Jack)

By -

Well as ever lately, yesterday morning's decline didn't last, and FOMC boosted ES to a new high. The low on ES was parallel to the upper trendline of the possible broadening top on ES, so that is now a rising channel. Overnight we've risen close to the top of that channel and I'm looking for a reversal in the 1175 – 1177 area.

On that basis I'm thinking there's a reasonable chance of a gap fill today, though I note that MasterTheGap are saying in their free daily email that 'fading gaps that occur on a Wednesday of Options Expiration week following a new 50 day closing high has only resulted in 1 winner out of 5 for 'up' gaps' For anyone that doesn't receive this free daily email I'd strongly recommend adding it to your free subscriptions:

101013_ES_60min_Rising_Channel

Looking at the bigger picture, we've now broken declining resistance from the Oct 2007 high through the April high, my smaller SPX channel that I posted yesterday was pinocchioed through yesterday and looks likely to break this morning, and if SPX opens over 1174 then the post flash-crash high will also have been taken out. The next significant resistance I'm seeing is in the 1200 area and it doesn't look that strong of itself.

I said yesterday that I didn't like the level on USD for a reversal and EURUSD has broken recent declining resistance this morning. I was also interested to see that yesterday's decline confirmed the lower channel trendline of a potential rising channel which looks bullish and gives a target in the 1.4225 to 1.425 area for another move up. That should fit well with a hit on my USD key support level at 75.75:

101013_EURUSD_60min_Rising_Channel

One chart that does still look bearish, even if rising wedges have been tending to break up lately, is the /TF chart where there is a nicely formed rising wedge from the August low. Thanks to bloodwine for pointing this out to me yesterday as this is definitely worth watching, as well as offering some decent trading opportunities trading the trendline hits:

101013_TF_60min_Rising_Wedge

I was looking through some charts yesterday and hooked out a couple that I've posted in the past that looked interesting. The first that I'd like to repeat is the SPX daily 20sma chart, where the last significant reversal found support at the 20sma, as is often the case:

101013 SPX Daily 20 SMA

The other chart is a chart I posted a few weeks ago showing a possible bearish gartley pattern developing on SPX. Keirsten pointed it out and I mentioned then that the pattern target for this upleg would be in the 1175 SPX area. This a good day to hook this out as we're there now, though I'm not suggesting that I'm expecting a serious reversal here. The pattern target is plus or minus twenty points or so though and I am seeing very significant levels coming up elsewhere in the next few days:

101013 SPX Daily Bearish Gartley Pattern

I won't post the charts for that possible reversal level today as I've been rationing myself to five charts a day lately, but I'll post them in the next day or two. The potential triggers for the reversal though would be USD reaching the very key rising support trendline in the 75.75 area, and copper reaching a key resistance trendline in the 392 – 4 area. Those might only mark a short term high of course, but I'm expecting to see something happen there.

There is something else to mention as well. I was talking to someone yesterday (who doesn't want to be named), and they observed that there is a very significant swing high or low in late September or October almost every year going back a very long way. I charted this for the last thirty years yesterday and he's right. We haven't seen that significant high or low yet, and there's every reason to expect that we will. If we reached 1195 and then retested the IHS neckline at 1130 that would be good enough to qualify but it could be a bigger reversal of course. I'll be doing a full review of the last thirty years of these October reversals this weekend.

Preparing to Pass the Disappointment Baton

By -

I entered the day with a large long SPY position, and I remain long the SPY. It was a losing day for me, due to my many shorts, but this loss was attenuated by my SPY long hedge. I intend to remove this hedge once I feel the SPY has, in all probability, exhausted its run. I think the bulls are about to be as sorely disappointed as they – – and the bears – – have been on multiple occasions over the past year.

0913-sadbulls