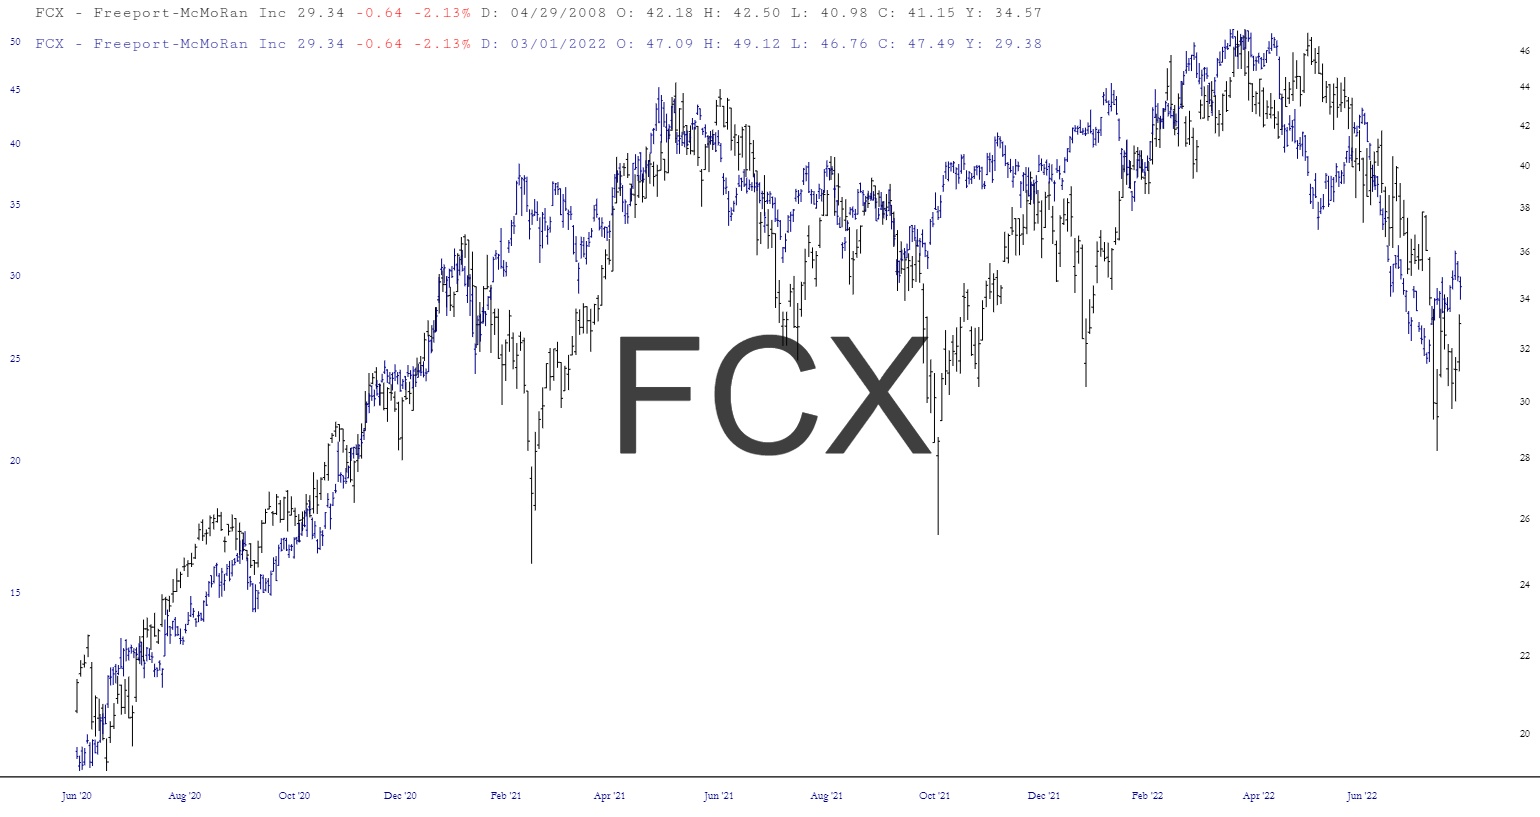
Sloper LZ wrote to me and offered to share these charts with the group with the message that “Does that 2008 top look like the current top? If the analog holds, it screams deflation is coming.” Thank you, LZ!
Slope initially began as a blog, so this is where most of the website’s content resides. Here we have tens of thousands of posts dating back over a decade. These are listed in reverse chronological order. Click on any category icon below to see posts tagged with that particular subject, or click on a word in the category cloud on the right side of the screen for more specific choices.
Sloper LZ wrote to me and offered to share these charts with the group with the message that “Does that 2008 top look like the current top? If the analog holds, it screams deflation is coming.” Thank you, LZ!

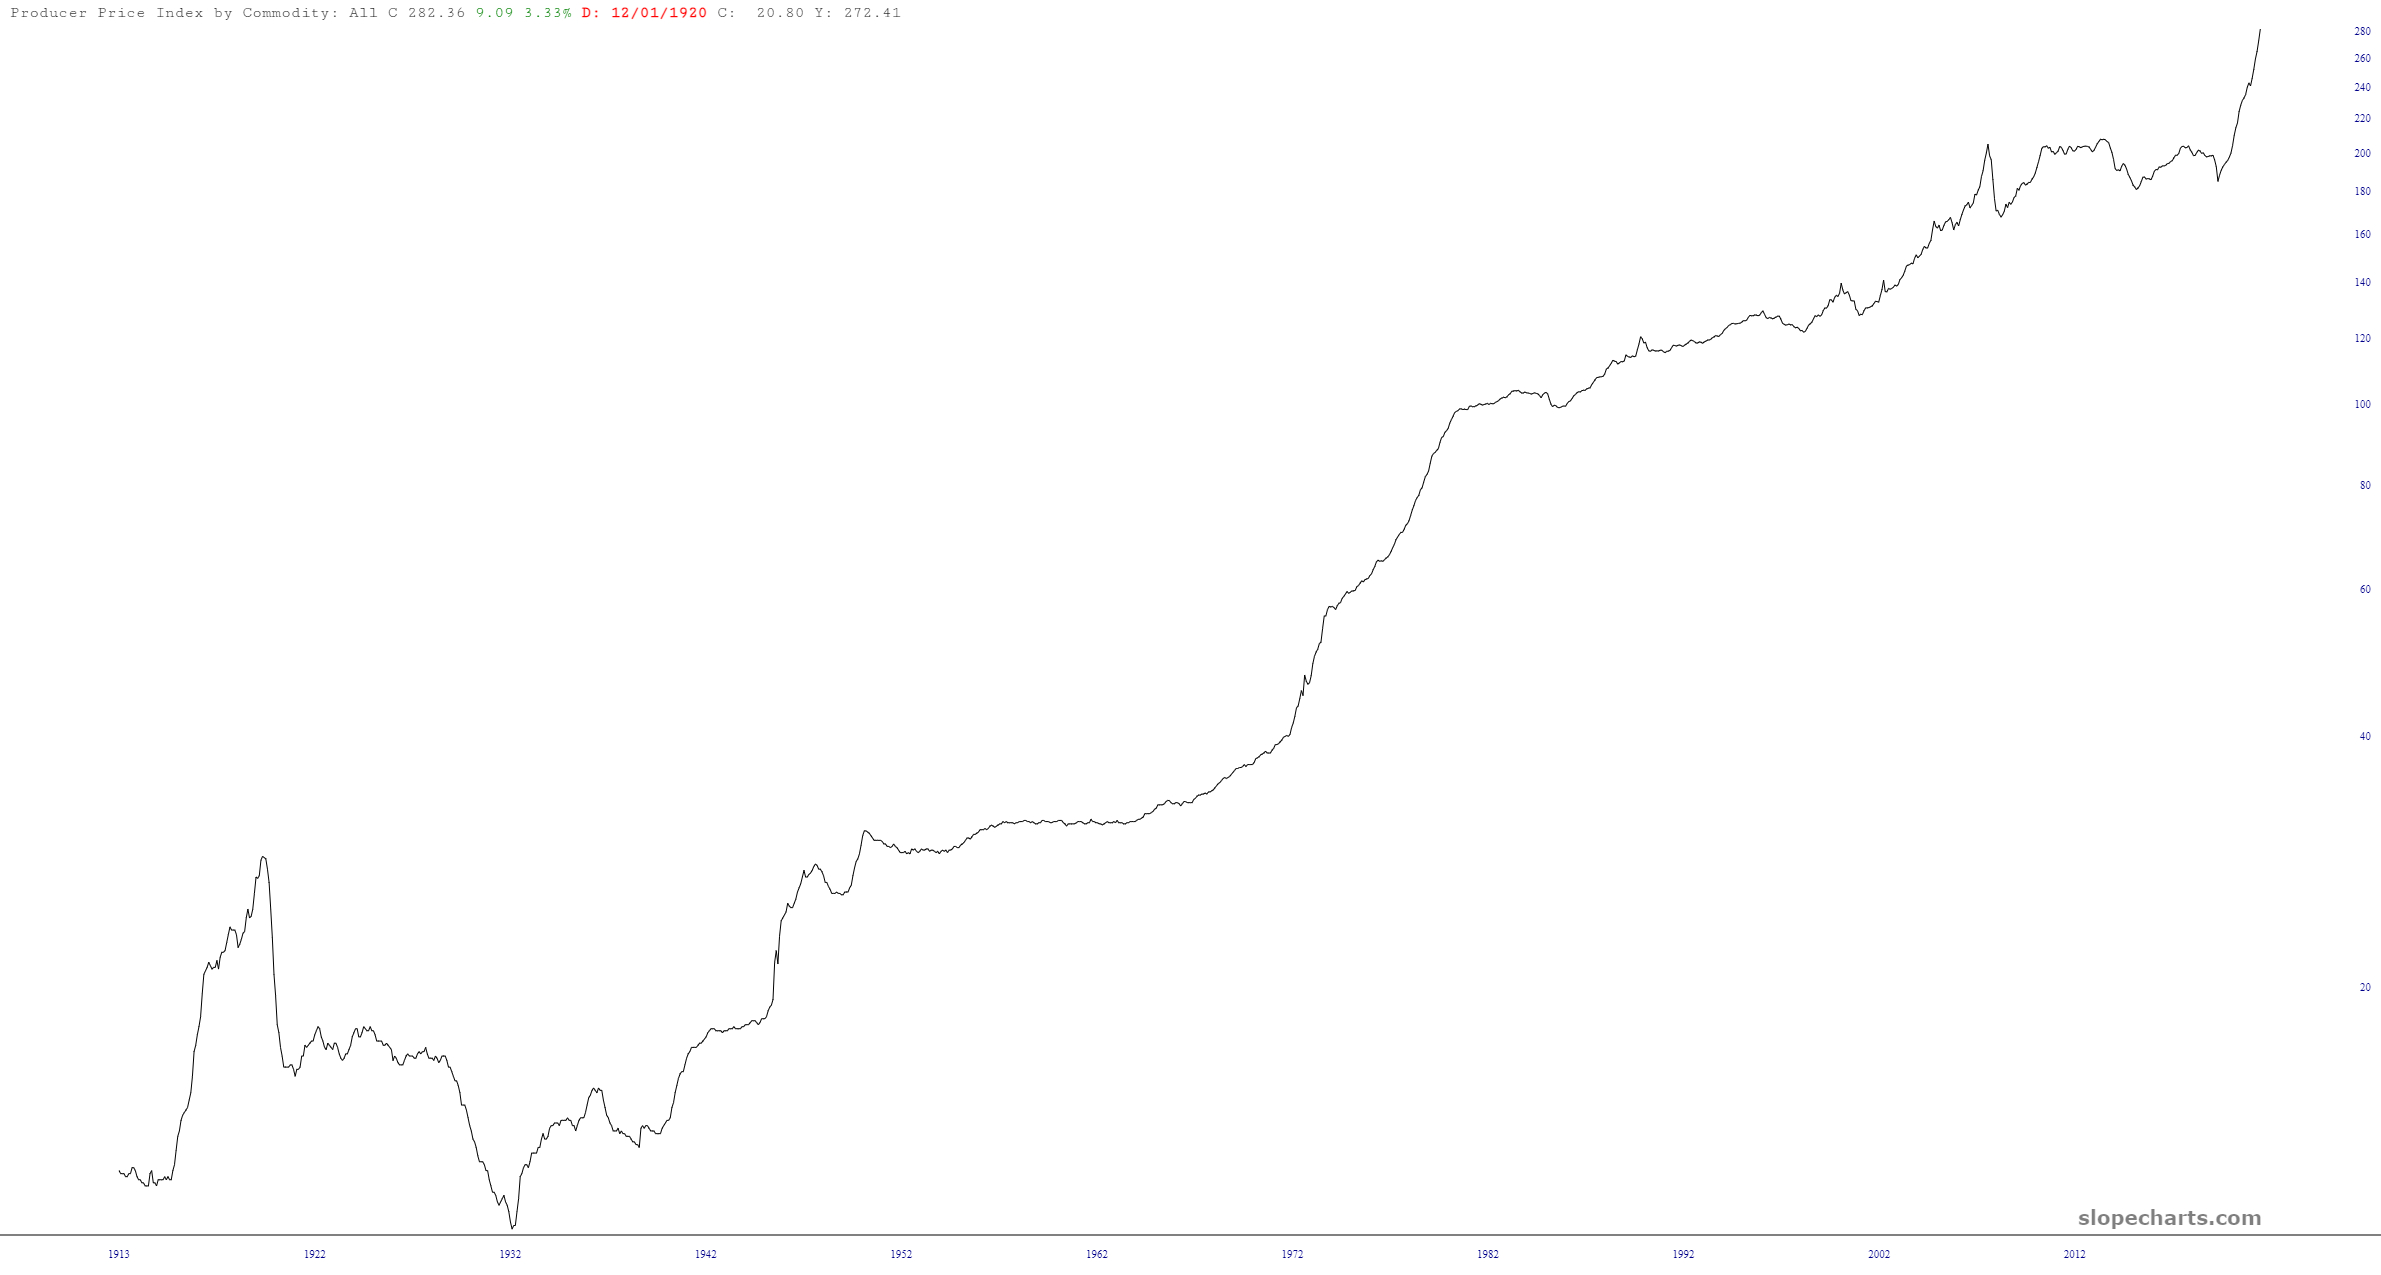
The economic database in SlopeCharts is positively vast, and I was curious what we had in terms of Produce Price Index. Well, it goes back to 1913! Check it out:
Good morning, everyone. I haven’t looked at even a single comment from my tell-them-how-you-really-feel post from last night, but perhaps I will later. It’s occasionally good to turn my honesty dial up from 1% to 5% and see what happens.
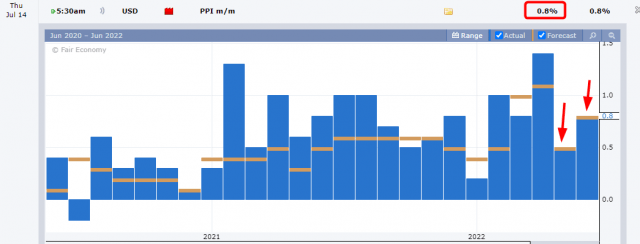
The PPI came out, and we’re three for three at three point. In other words, all the inflation indicators have come in red-hot compared to the forecast. Yep.
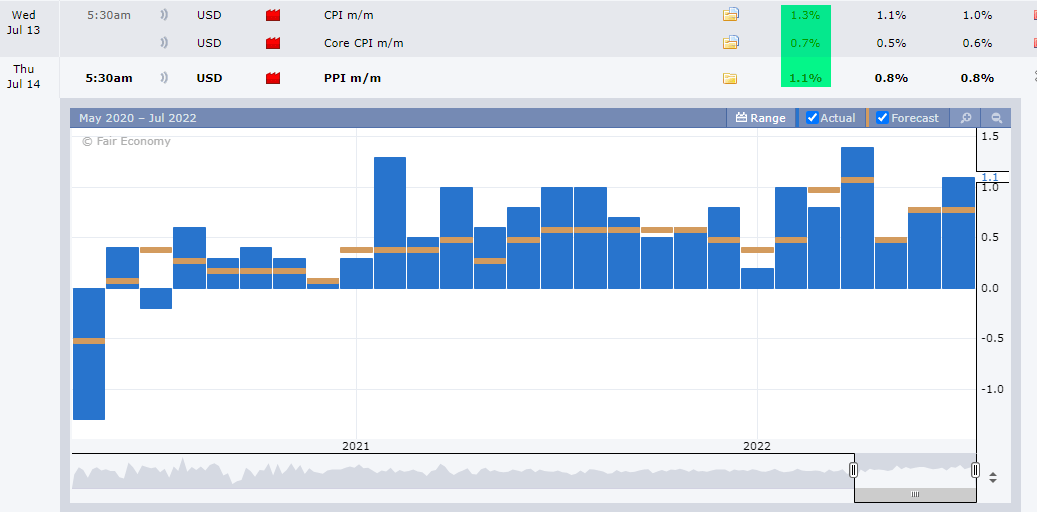
Now that all the breathless anticipation of the CPI amounted to a hill a beans in the end, but here’s the projection for the Producer Price Index, which the last two months precisely met projections: