Slope of Hope Blog Posts

Slope initially began as a blog, so this is where most of the website’s content resides. Here we have tens of thousands of posts dating back over a decade. These are listed in reverse chronological order. Click on any category icon below to see posts tagged with that particular subject, or click on a word in the category cloud on the right side of the screen for more specific choices.

Three Compelling Charts

By -

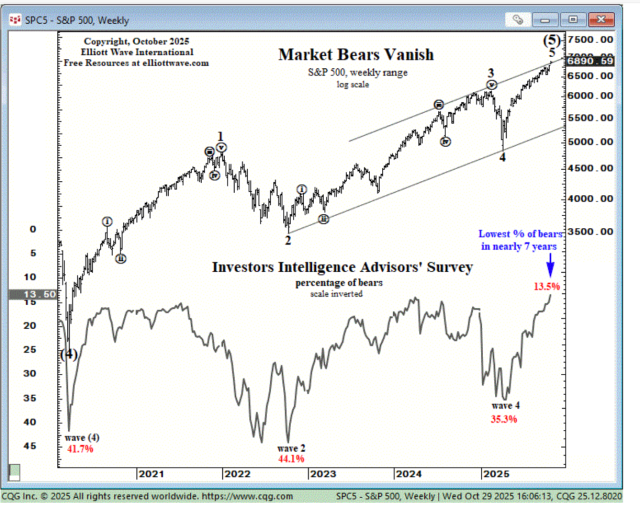
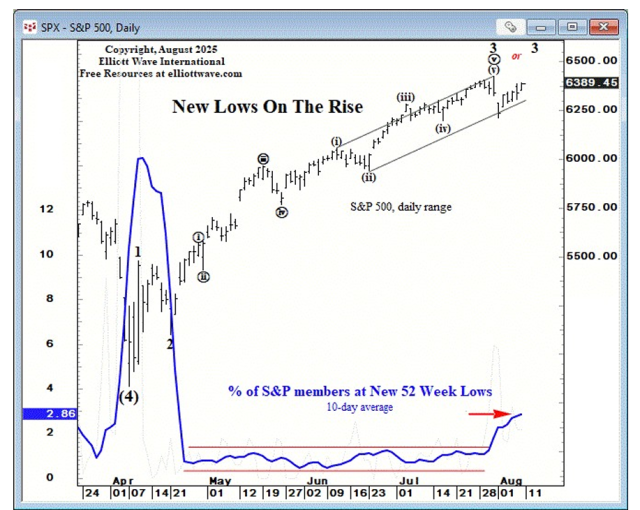
Our friends at Elliott Wave published three charts I wanted to share. The first is my favorite, because it shows that bears have now gone extinct. The investors “intelligence” survey illustrates that advisors haven’t been this bullish in a full seven years. Looking at this chart, it seems to me that extreme bearishness is a better pivot indicator than extreme bullishness (notice how many times the bullish percentage was high, but the market kept chugging along).

(more…)

Fibonacci Durations

By -

Courtesy of Elliott Wave International, and used with permission:

Why We Are Watching 2021

The April Elliott Wave Theorist is a rare video issue on the outlook for three key market sectors – stocks, commodities and interest rates. Editor Robert Prechter delivered this presentation on January 18, 2021. Interest rates have followed the script by rising sharply, and they have more to go. Commodities gained since that time as well. The current price action in the stock market makes now a good time to keep in mind our timing work in that sector.

We’re going to look at a 200-plus year chart of U.S. stocks prices. The data is the Dow Industrial Average going back to the 1880s. Prior to that, it’s data from different indexes that newspapers and other sources kept back in the 1800s.

(more…)