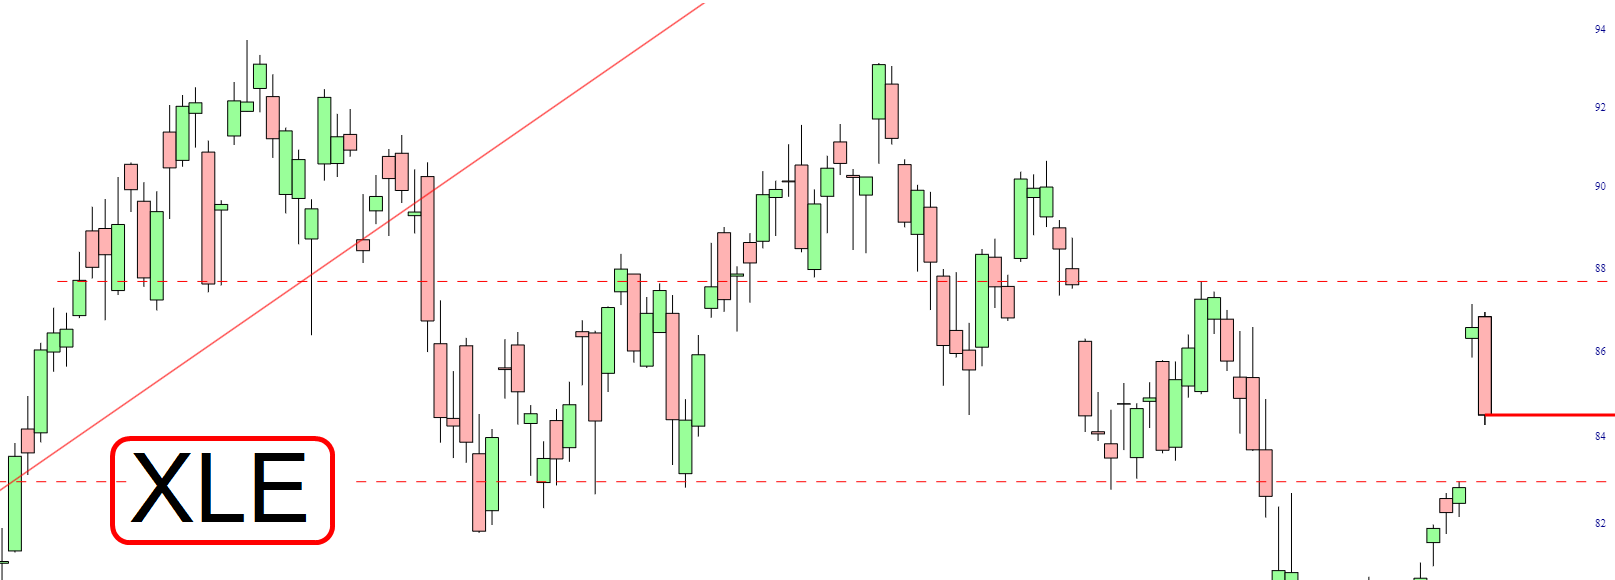
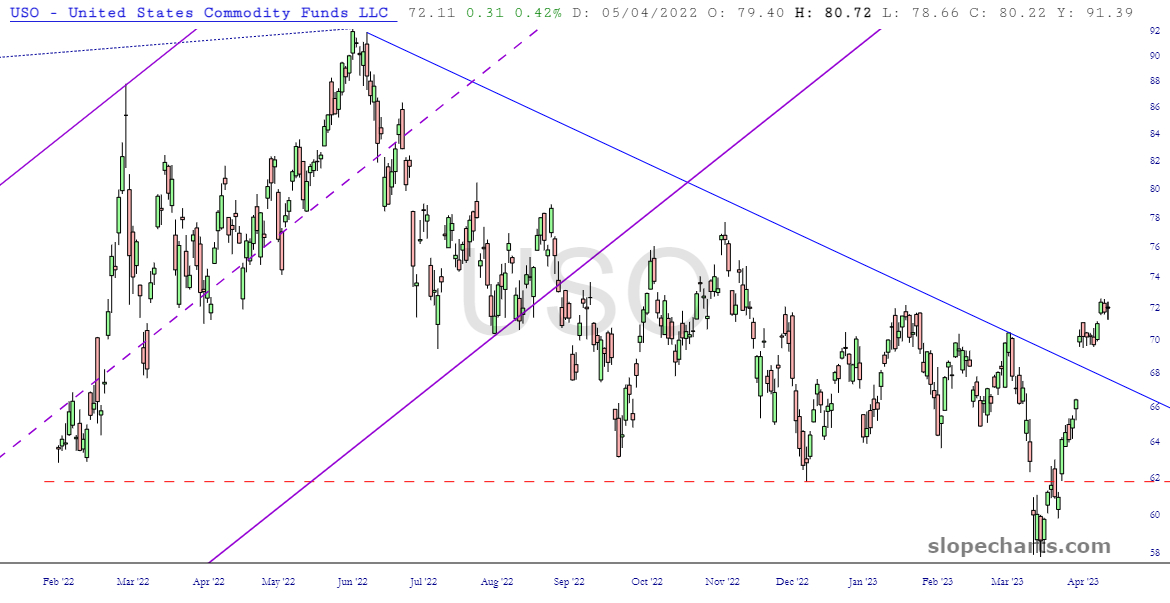
The surprise OPEC+ announcement two weekends ago solidly pushed oil over what had been a descending trendline of resistance.
Slope initially began as a blog, so this is where most of the website’s content resides. Here we have tens of thousands of posts dating back over a decade. These are listed in reverse chronological order. Click on any category icon below to see posts tagged with that particular subject, or click on a word in the category cloud on the right side of the screen for more specific choices.
The surprise OPEC+ announcement two weekends ago solidly pushed oil over what had been a descending trendline of resistance.
Last year, when this long-term sinewave on natural gas was sky-high, I pointed out the opportunity to go short /NG. Well, this thing has been utterly clobbered, and it seems to me we’ve reached an important low. It sure didn’t take long.

Good morning, everyone, and welcome to a shortened trading week. I won’t gripe about this three-day weekend as much, since I actually consider the holiday at hand to be legit, although I’ll still be grinding my teeth at the lengthy time away from the keyboard.
This day begins, of course, with oil, which is the big change from the last few weeks in which some bank disaster or another was the news of the day. This time, the global energy cartel has decided to poke its best customer in the eye, and although it’s off its highs from the initial spike, oil is still up about 6%.