On the heels of yesterday’s historic mega-rally, it will be absolutely terrifying to push back deeply into the bear camp but judging from what I saw with my chart examination last night, that’s precisely what I plan to do.
Slope initially began as a blog, so this is where most of the website’s content resides. Here we have tens of thousands of posts dating back over a decade. These are listed in reverse chronological order. Click on any category icon below to see posts tagged with that particular subject, or click on a word in the category cloud on the right side of the screen for more specific choices.
On the heels of yesterday’s historic mega-rally, it will be absolutely terrifying to push back deeply into the bear camp but judging from what I saw with my chart examination last night, that’s precisely what I plan to do.
Here’s an interesting chart for you: the S&P 500. What’s cool about it is that today’s mega-rally sent it precisely, and I do mean precisely, to the Fibonacci resistance line. If it weren’t for the fact I’m lying horizontal on a sofa, my jaw would be hanging open.
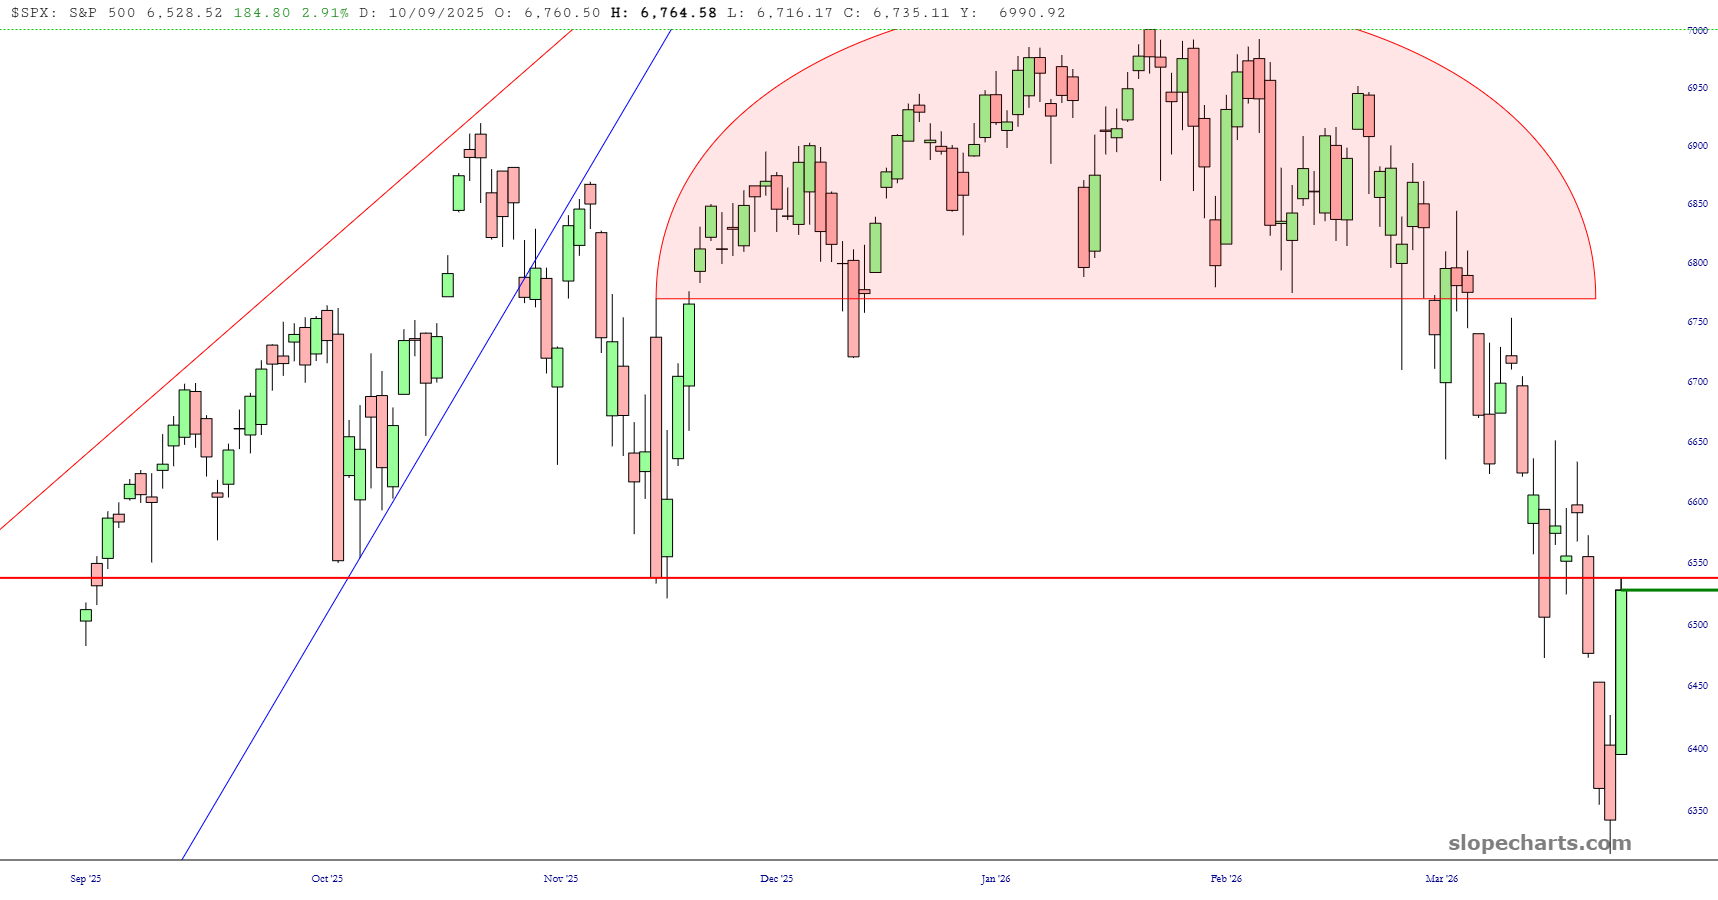
Have we maybe reached a medium-term peak?
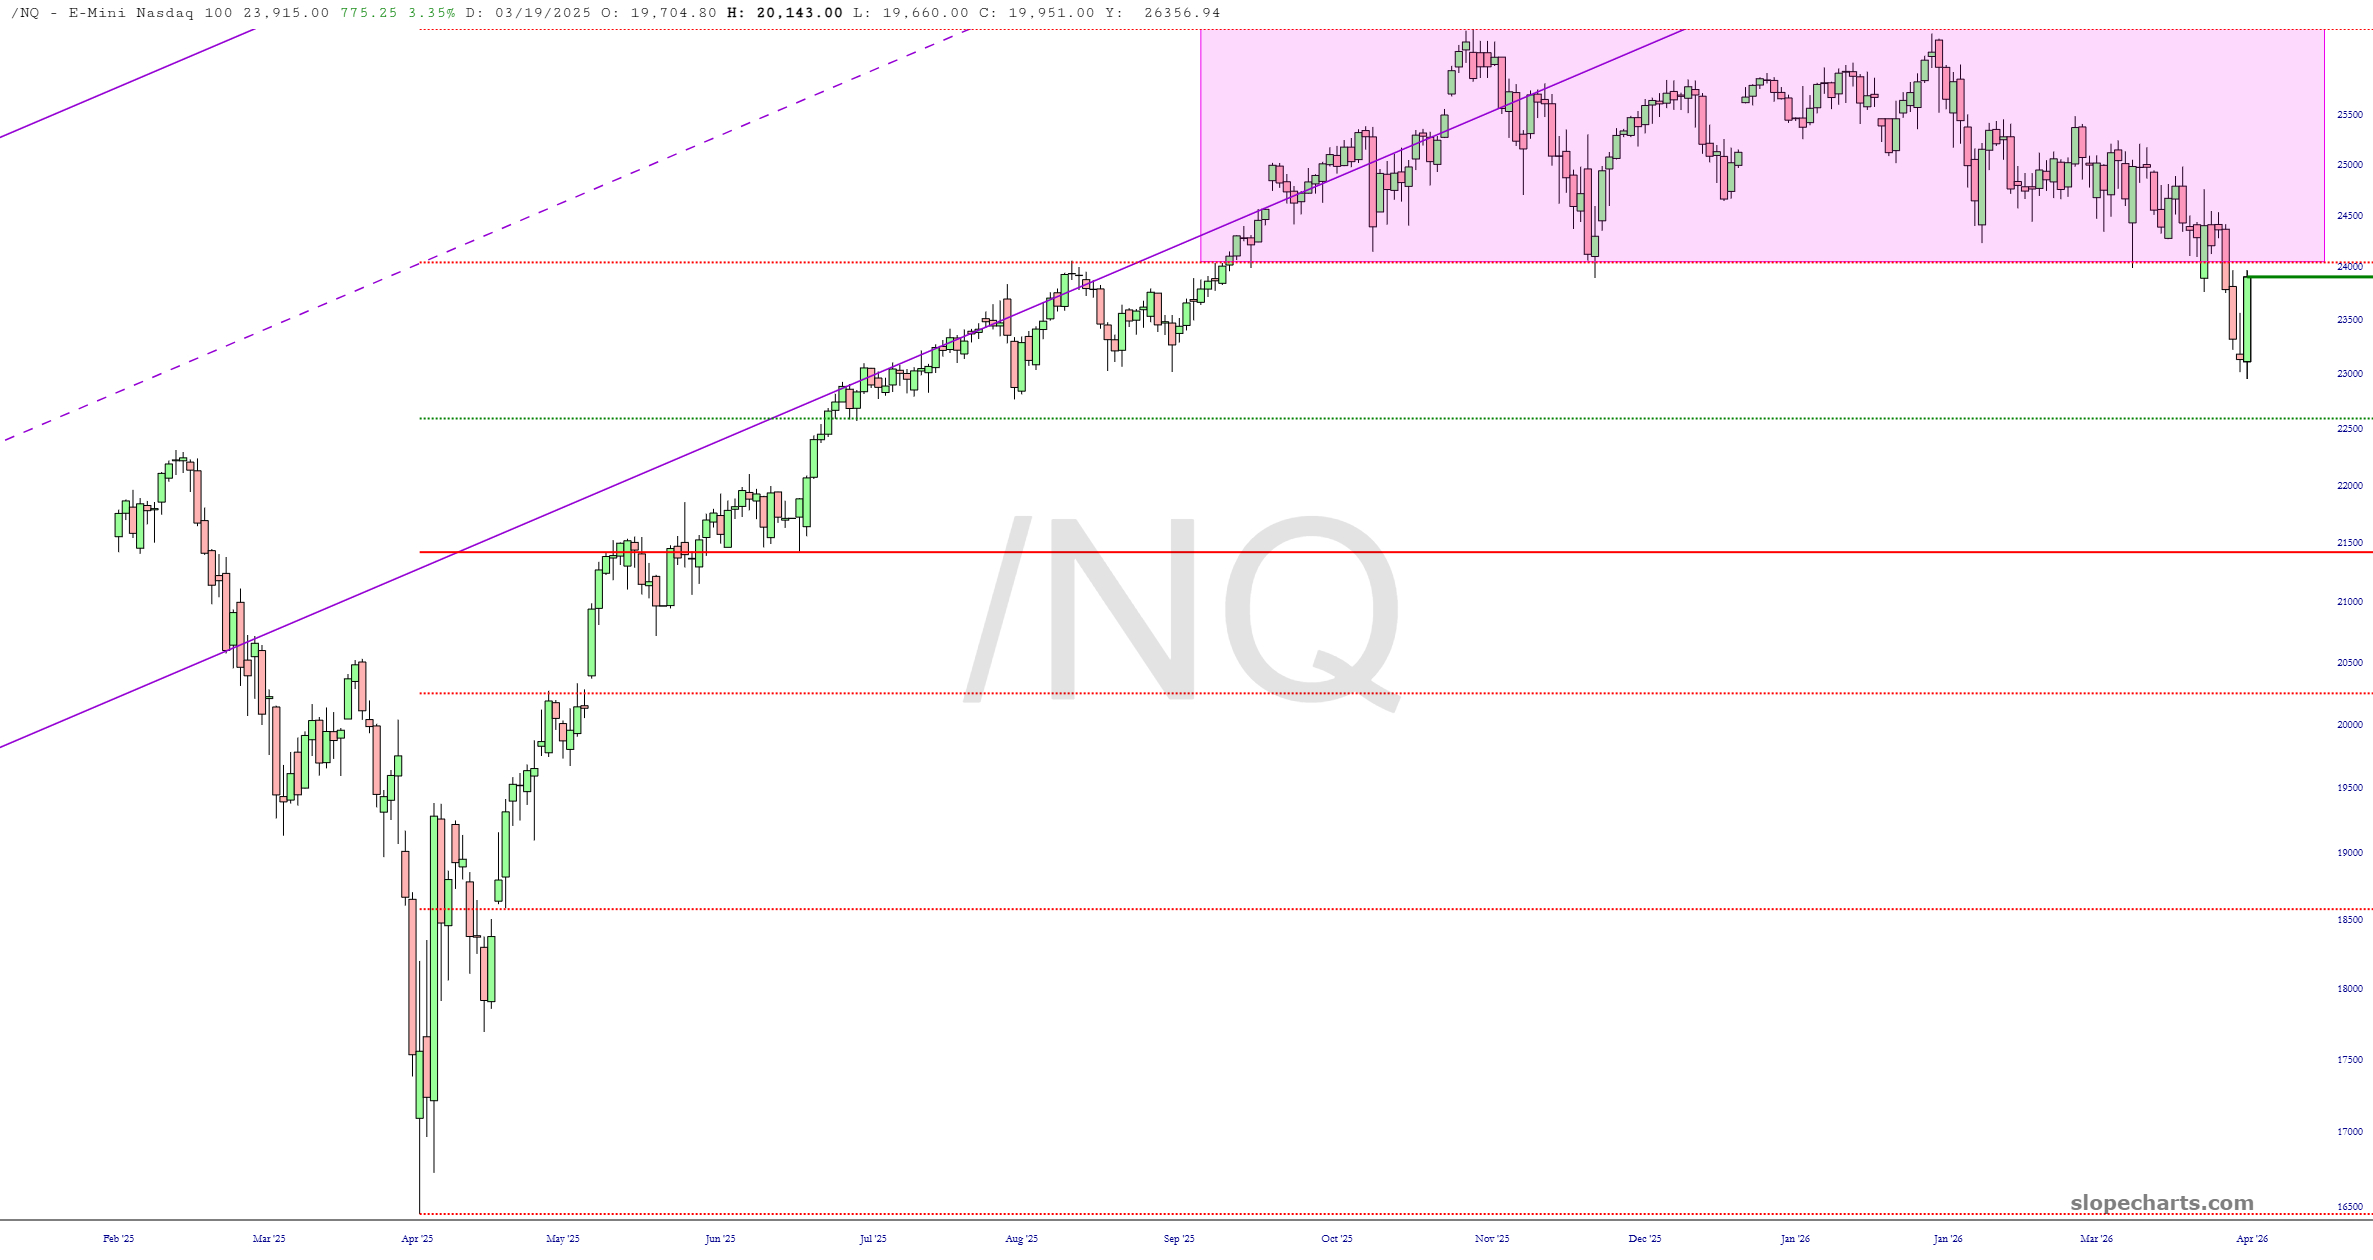
Today probably marked the low for a bit……….those Fibonaccis are potent:
I’ll start off with a simple fact: on an intraday basis, today was the highest price level in the history of the Milky Way Galaxy on almost every major index. Also, today my entire portfolio was 25 short positions, and of those, 19 closed down and 6 closed up. Added to which, some of the downs were much meatier than the ups, the largest of which was 1.59% (versus -6.05% for the biggest down). The point I am trying to make is that carefully-selected charts can sometimes defy the market.

