
I’ll start off with a simple fact: on an intraday basis, today was the highest price level in the history of the Milky Way Galaxy on almost every major index. Also, today my entire portfolio was 25 short positions, and of those, 19 closed down and 6 closed up. Added to which, some of the downs were much meatier than the ups, the largest of which was 1.59% (versus -6.05% for the biggest down). The point I am trying to make is that carefully-selected charts can sometimes defy the market.

Yesterday’s AMD debacle was, in retrospect, an interesting gusher. Only after it was all over did I realize that the day’s high came within pennies of the lifetime high (see horizontal) and that the bar rammed right up against the long-term trendline and stayed stuck there.
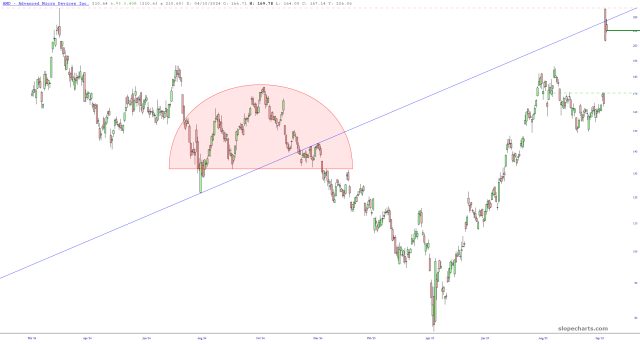
I am highly confident that AMD will wither back down to its gap (at least), just as I’m sure that a similar breathless mega-rally in ORCL (September 10th) will wither back to its own gap.
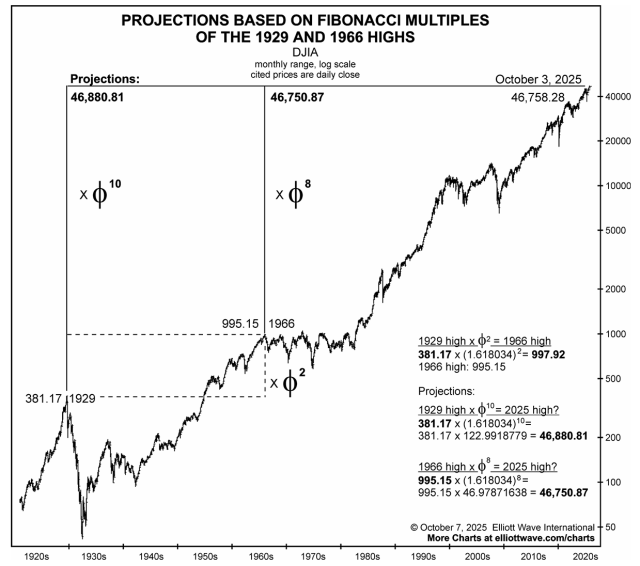
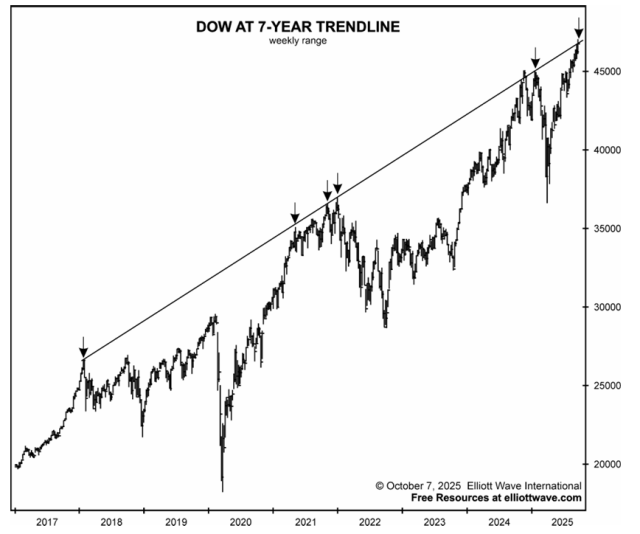
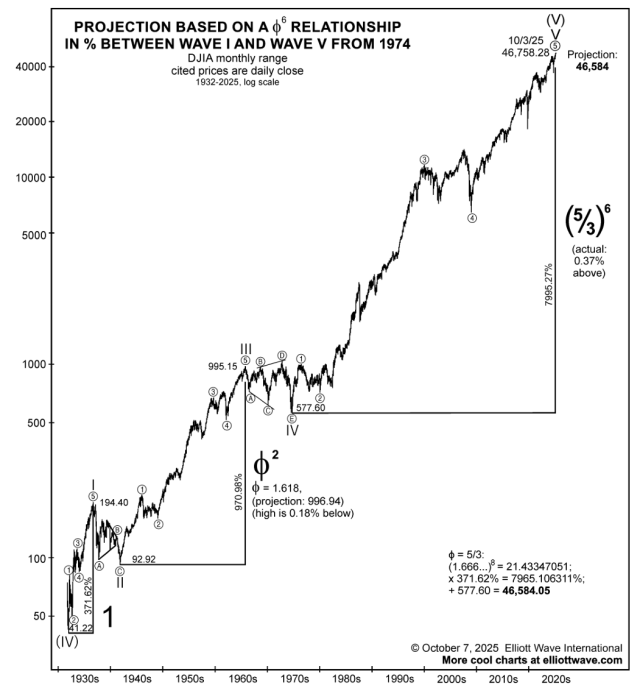
Our friends at Elliott Wave sent out a late-breaking update to their charts, and they are absolutely beautiful. (They’ll be EXTRA beautiful if they wind up actually meaning anything because, bless ’em, the EWI lads do amazing work, but sometimes the chart, no matter how gorgeous, isn’t as predictive as one might hope; still, hope in the bearish breast springs eternal).
As I close out this day, I am fairly heavily committed at about 140% spread out over 25 short positions, as mentioned above. You should probably slap me, but I took handsome profits off the table from my PALL trade and, just to tempt the precious metals gods, bought into a DUST position on Tuesday as well.
In general, Tuesday went really well for me, and in this data-free world in which we now reside, I’m hoping to make Wednesday a winner as well.
