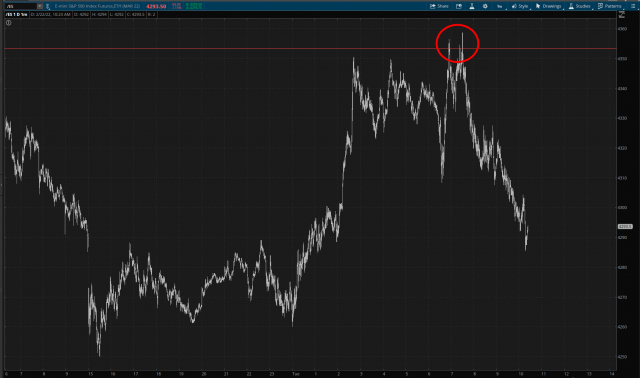
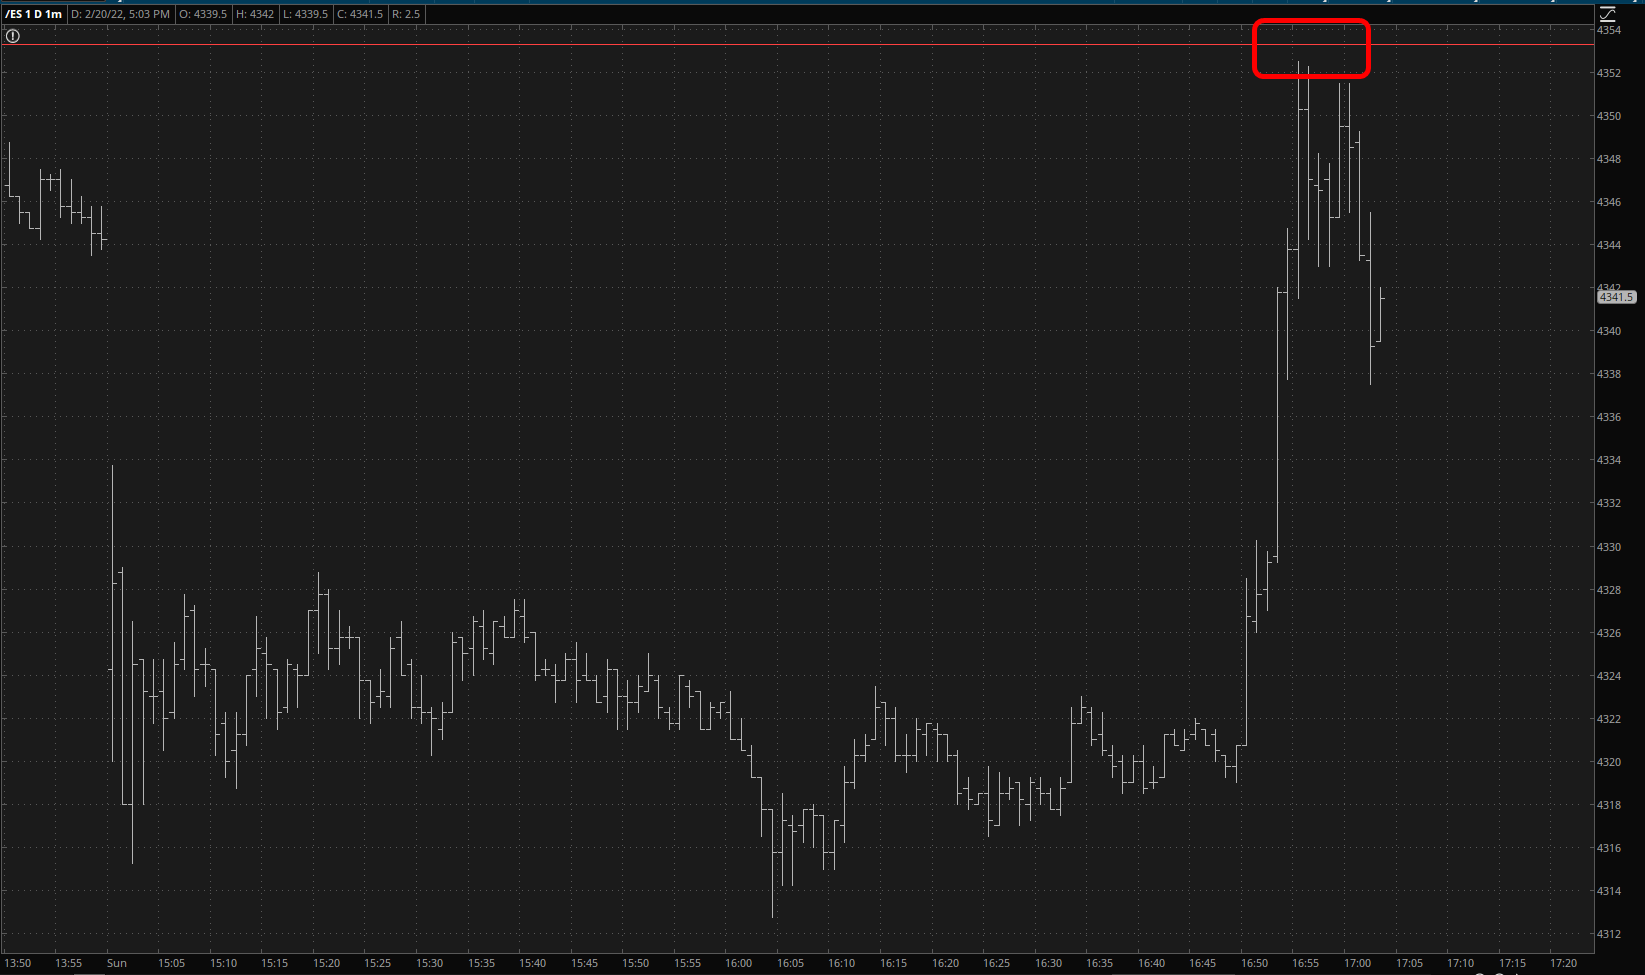
It’s like magic! Here’s the /ES………
Slope initially began as a blog, so this is where most of the website’s content resides. Here we have tens of thousands of posts dating back over a decade. These are listed in reverse chronological order. Click on any category icon below to see posts tagged with that particular subject, or click on a word in the category cloud on the right side of the screen for more specific choices.
There aren’t many useful conclusions that can be drawn with two hours of thin trading on a Sunday, but I will at least note this interesting tidbit. After the ES went plunging nearly 30 points, it actually rallied into the green. But look at the red line and how prices were rejected from it. What’s THAT all about?
The equity markets are surging higher this morning, I have almost nothing but short positions, and I think it’s great. Why? Well, because the markets are behaving in a completely chart-friendly manner, and the 23.6% retracement level I warned premium members about yesterday did a picture-perfect job calling for a bounce, which is why I covered my largest position, my IEFA short. There’s no doubt I’m going to see my positions weaken substantially at the open. It doesn’t matter, because the charts are behaving beautifully, and that’s really what I’m after. Plus, I have a ton of free cash available.
(more…)Courtesy of Elliott Wave International, and used with permission:
Why We Are Watching 2021
The April Elliott Wave Theorist is a rare video issue on the outlook for three key market sectors – stocks, commodities and interest rates. Editor Robert Prechter delivered this presentation on January 18, 2021. Interest rates have followed the script by rising sharply, and they have more to go. Commodities gained since that time as well. The current price action in the stock market makes now a good time to keep in mind our timing work in that sector.
We’re going to look at a 200-plus year chart of U.S. stocks prices. The data is the Dow Industrial Average going back to the 1880s. Prior to that, it’s data from different indexes that newspapers and other sources kept back in the 1800s.
(more…)Early this year, I took a deep breath and uttered what I thought was a laughable price target on Bitcoin, which was based on its Fibonacci extension. The target was above $73,000 and, hard as it may be to believe, we’re getting awfully close, with “only” about 15% to go.

