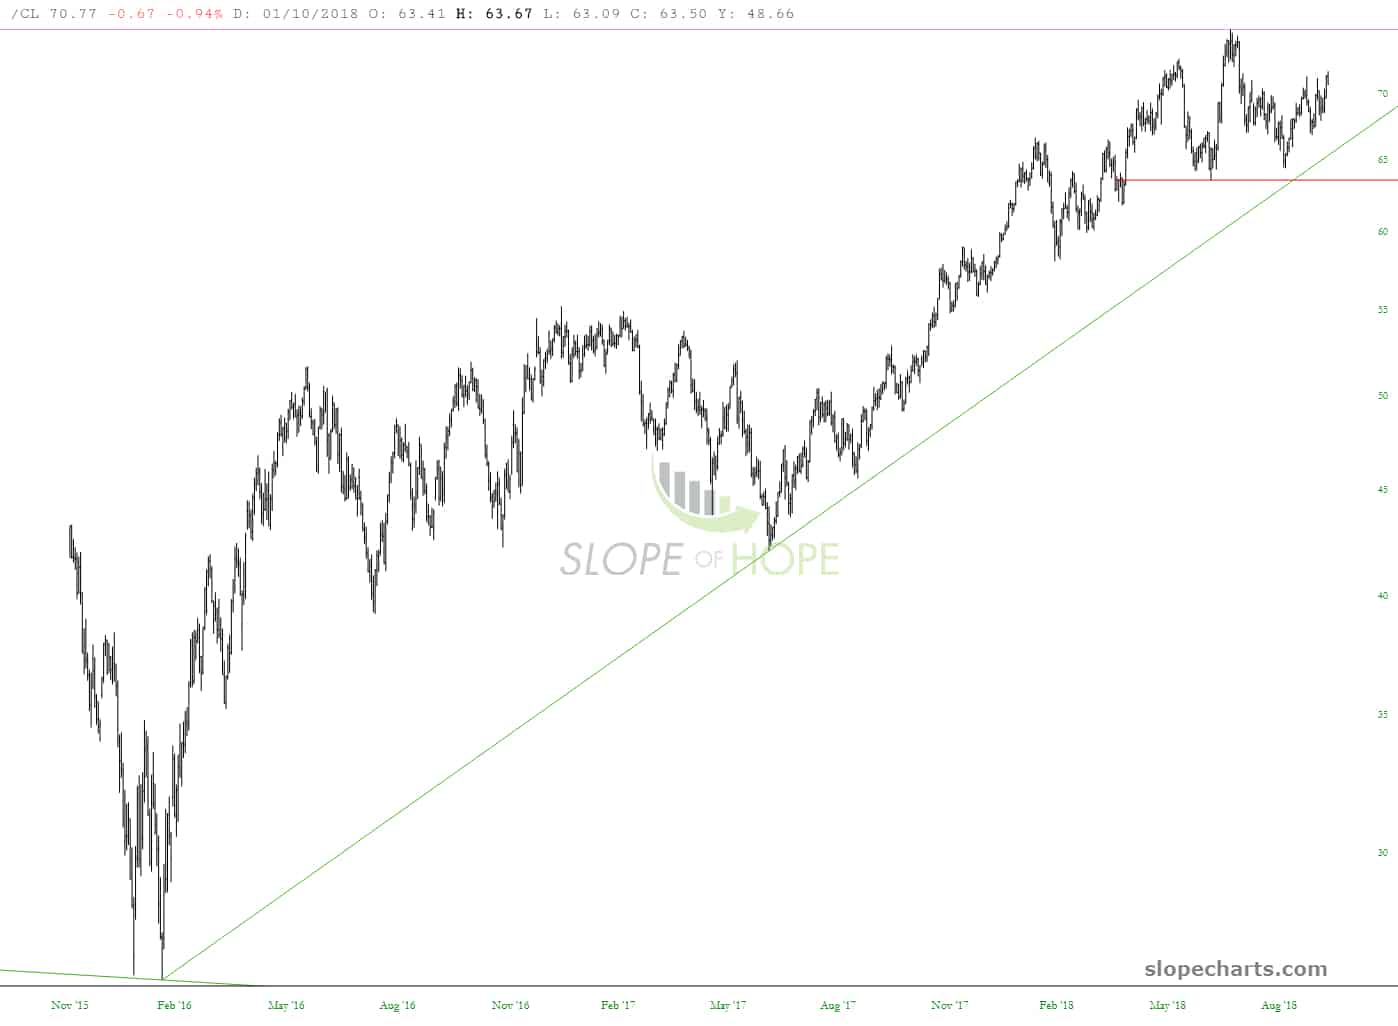
Crude oil has been sailing above its supporting trendline for a couple of years now. I am, of course, watching with great interest to see if we get a break of that uptrend.
Slope of Hope Blog Posts
Slope initially began as a blog, so this is where most of the website’s content resides. Here we have tens of thousands of posts dating back over a decade. These are listed in reverse chronological order. Click on any category icon below to see posts tagged with that particular subject, or click on a word in the category cloud on the right side of the screen for more specific choices.
The Fibonacci Trio
SlopeCharts has had Fibonacci Retracements ever since it was launched last year. Today, however, we have tripled the number of Fibonacci tools, adding both the Arc and the Fanlines. The icon still looks the same, but now when you click the seashell, you will see three tool choices.
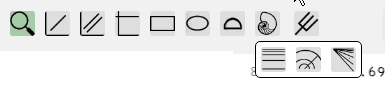
To use any Fibonacci tool on a chart, choose the seashell icon:

Three tool choices appear which are, from left to right, price retracements, arcs, and fanlines. Click any of the three to choose that tool (or click the seashell again to deselect).
SPX Fibonacci Fan Resistance Levels/Targets
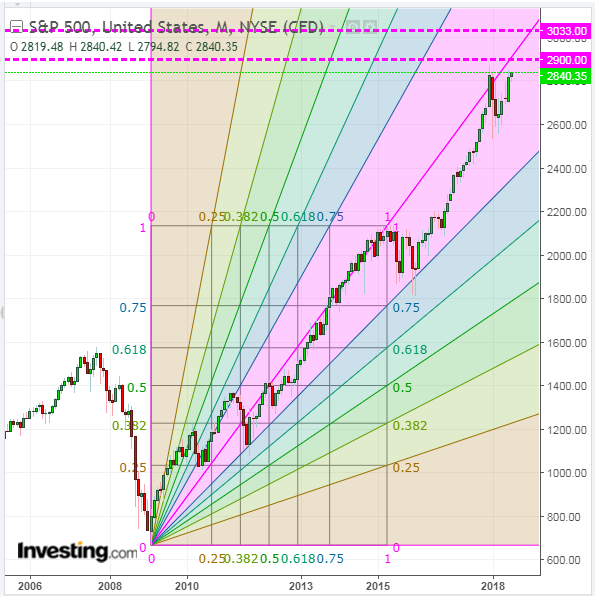
Overlayed on each of the following two monthly charts of the S&P 500 Index (SPX) is a Fibonacci Speed Resistance Fan.
The first one is taken from the low of March 2009 to the high of May 2015, which preceded the last major pullback to first fanline support and prior to the recent minor one this past February. Based on this fan trajectory, the first major resistance level sits just above the last all-time high (of 2872.87) at 2900.
Oil Nears Potential Turning Zone (by MoneyMiser21)
The mighty weight of Slope’s bear power has been fully focused in oil as of late, as our beloved and hard working leader called a top on the black gold with accuracy that Dennis Gartman would pay for in U.S. dollar terms. (editor’s note: I’m touched!)
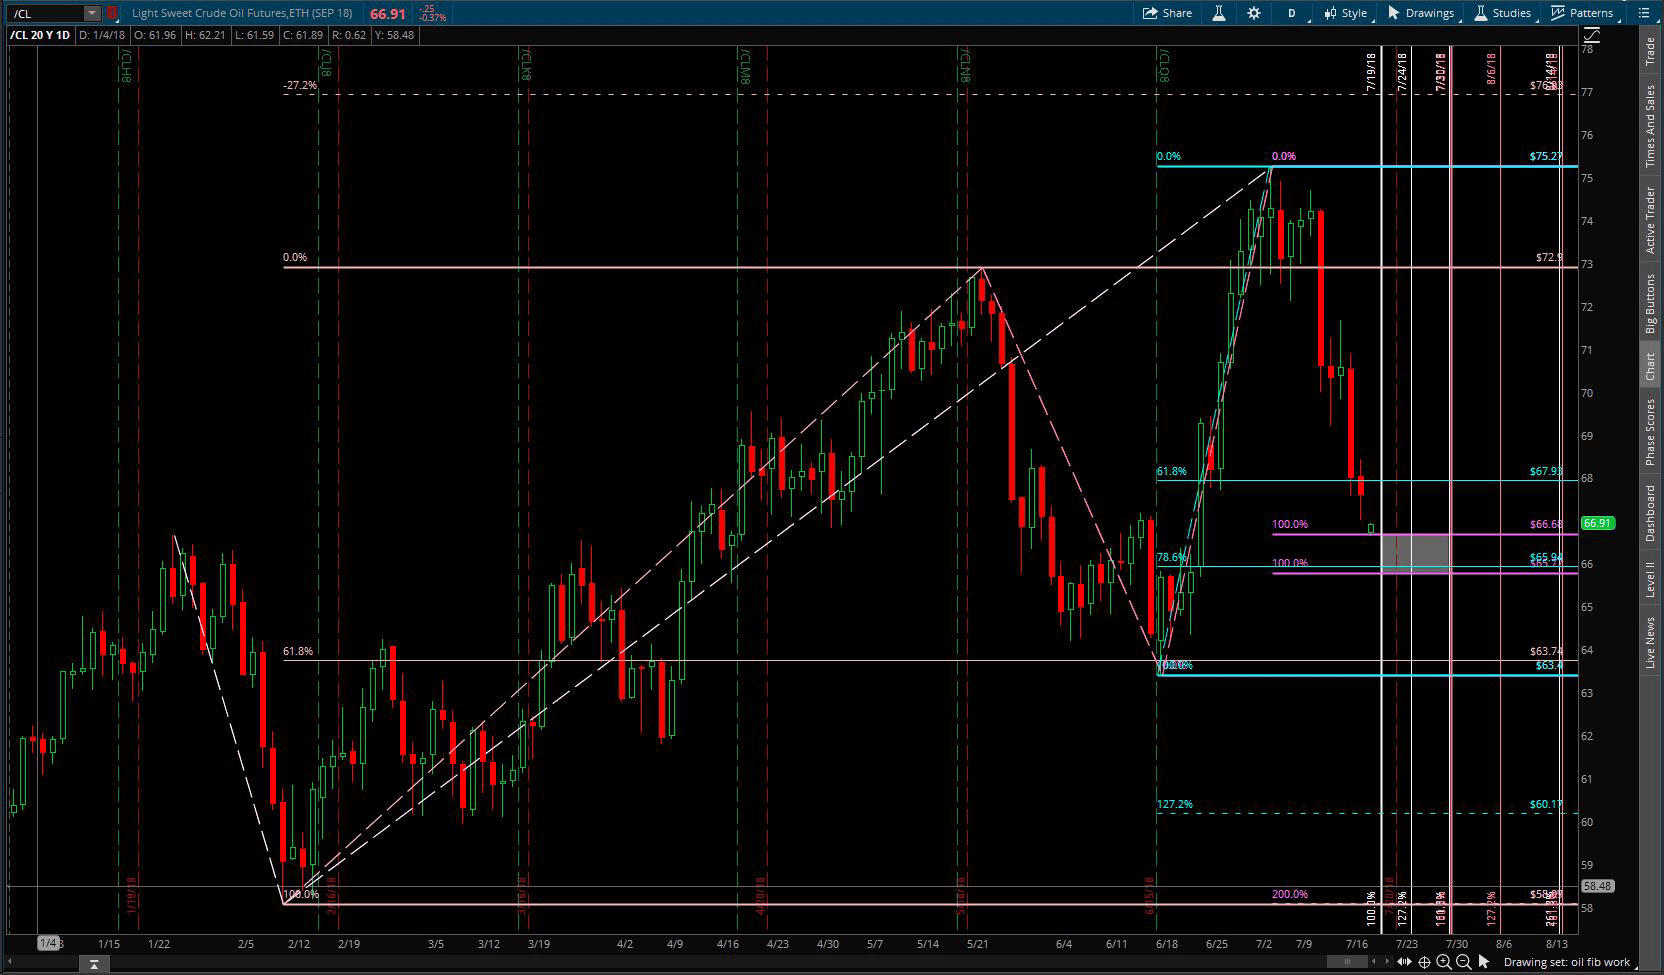
But is it time to pause or reverse? A bit of price and time analysis on the daily chart reveals a potential zone of trouble for bears.
First, let’s look at price.
When the front month contract switched to September on Tuesday evening, price gapped lower on the continuous chart to the top of the zone predicted by prior swing retracements in price amount during this bull market.
S&P 500 Index Over-Extended on a Fibonacci Basis
The following monthly chart of the S&P 500 Index (SPX) simply shows the monthly closes from its inception.
January’s (2018) close of 2823.81 nearly tagged its long-term 140% trend-based Fibonacci extension level of 2836.
As of 2:03 pm ET today (Monday), its price is currently below its 1.27% Fibonacci extension level of 2625.
Failure to recapture and hold 2625 could see price eventually decline further to 2220 (its 1% Fib extension level), or lower to around 2100, due to a lack of major price consolidation support below its current price until then. (more…)
