Even though these “coins” are hot off the proverbial press, yes, you can watch their every move in SlopeCharts!

Slope initially began as a blog, so this is where most of the website’s content resides. Here we have tens of thousands of posts dating back over a decade. These are listed in reverse chronological order. Click on any category icon below to see posts tagged with that particular subject, or click on a word in the category cloud on the right side of the screen for more specific choices.
Even though these “coins” are hot off the proverbial press, yes, you can watch their every move in SlopeCharts!
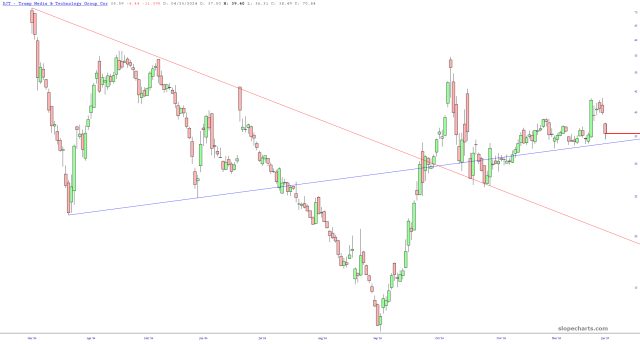
A real-time example of my Securitization of Feelings concept can be seen this morning in the plunge in price of the equity DJT. Simply stated, the Trump coin has sucked all the oxygen out of the room. Trump fans have a better, more volatile instrument with which to express themselves. DJT is boring.
In my last post on Monday I was looking at the bull and bear scenarios on the big three coins that I cover, with particular focus on the strongest setup on Bitcoin (BTCUSD). I was also noting the similar setup on equity indices at the same inflection point, which is important as both Crypto and equity indices have tended to be significantly correlated in the past, and there is no current sign that is different here.
Since then both Crypto and equity indices have rallied strongly and are both reached yesterday the verge of a final break up that would look for retests of many of their all-time highs.
(more…)