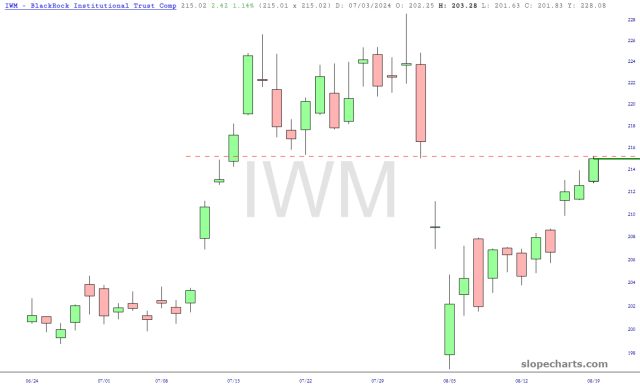
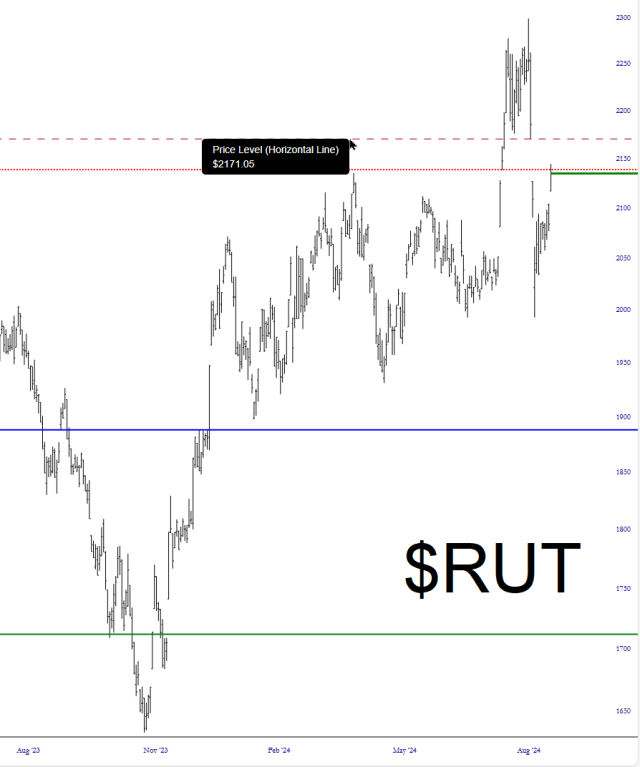
I’ll end the day with some major index charts and, highlighted, the critical gap levels.

Slope initially began as a blog, so this is where most of the website’s content resides. Here we have tens of thousands of posts dating back over a decade. These are listed in reverse chronological order. Click on any category icon below to see posts tagged with that particular subject, or click on a word in the category cloud on the right side of the screen for more specific choices.
Eli Lilly (LLY) has been one of the most merciless goes-up-all-the-time stocks in history, but recently it has done something surprising: created a major price gap and then perfectly filled it. Perhaps this is the end of the ceaseless ascent?

Over a span of just over two months, Dell (ticker symbol – – I’ll give you a moment – – yep, it’s DELL) lost nearly 50% (!!!!) of its value. Over the past few trading days, it has staged a mighty rally. I would suggest this bounce is similar to the last time, both tinted in yellow, and will meet the same fate. What’s key is the price gaps, which I’ve emphasized with red arrows.


Below are ten ETF charts with crucial gap levels (that is to say, resistance levels) highlighted. The first three are visible to everyone, and the other seven are visible to all paying members.
