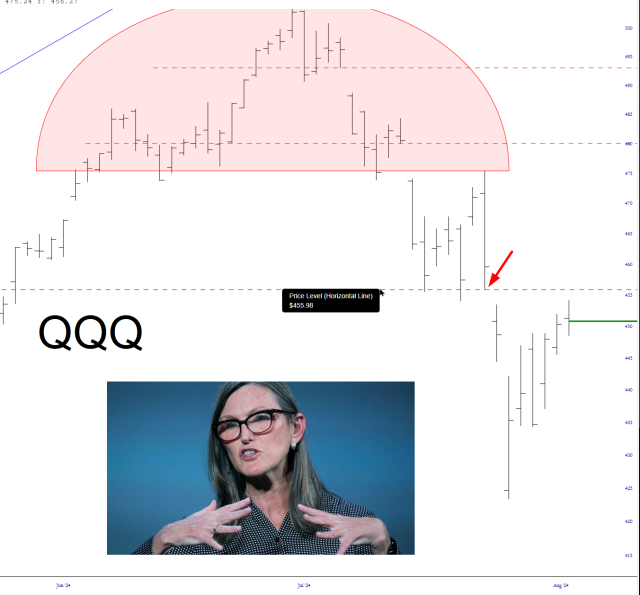
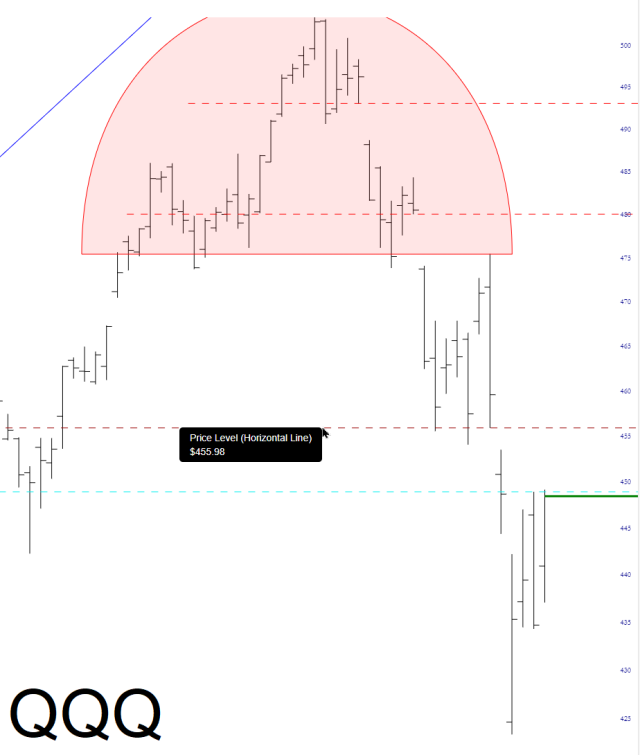
Another Key ETF Gap
Slope initially began as a blog, so this is where most of the website’s content resides. Here we have tens of thousands of posts dating back over a decade. These are listed in reverse chronological order. Click on any category icon below to see posts tagged with that particular subject, or click on a word in the category cloud on the right side of the screen for more specific choices.
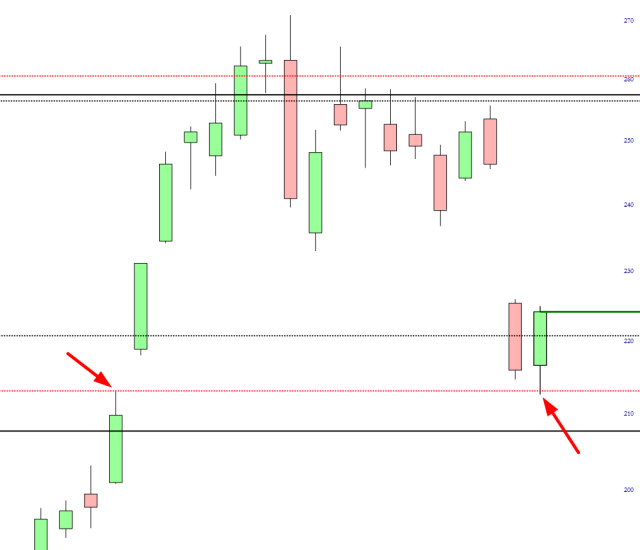
Below are ten ETF charts with crucial gap levels (that is to say, resistance levels) highlighted. The first three are visible to everyone, and the other seven are visible to all paying members.
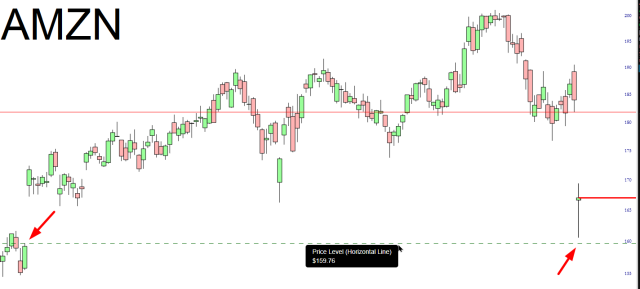
No, no, I’m not talking about Lauren, you dog. I’m talking about the AMZN chart. This was a beautiful fill, after the AMZN wipeout!
Whoops, I did it again! My target for a bottom for TSLA was the gap at $213, and bang-diddy-bang, we nailed it! Any recovery is going to be suppressed by the overhead supply now. I think we’ve seen the highs for 2024 already.
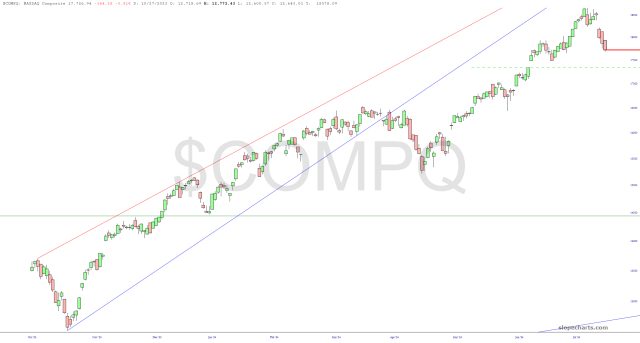
Let’s keep an eye on those price gaps on the tech stocks. I have highlighted the below with a dashed horizontal line here on the NASDAQ Composite: