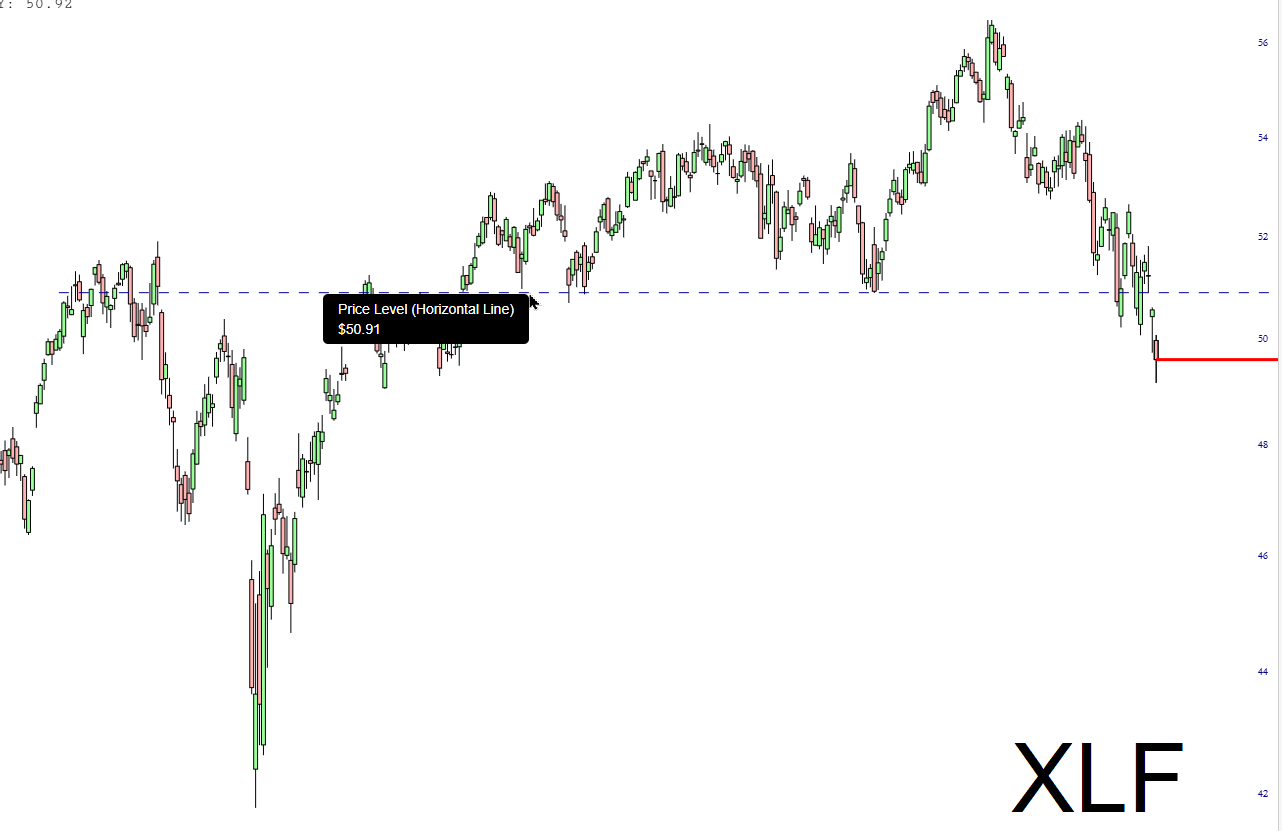
The ETF representing the financial stocks has completed a clean top with a well-defined gap at 50.91:
Slope initially began as a blog, so this is where most of the website’s content resides. Here we have tens of thousands of posts dating back over a decade. These are listed in reverse chronological order. Click on any category icon below to see posts tagged with that particular subject, or click on a word in the category cloud on the right side of the screen for more specific choices.
The ETF representing the financial stocks has completed a clean top with a well-defined gap at 50.91:
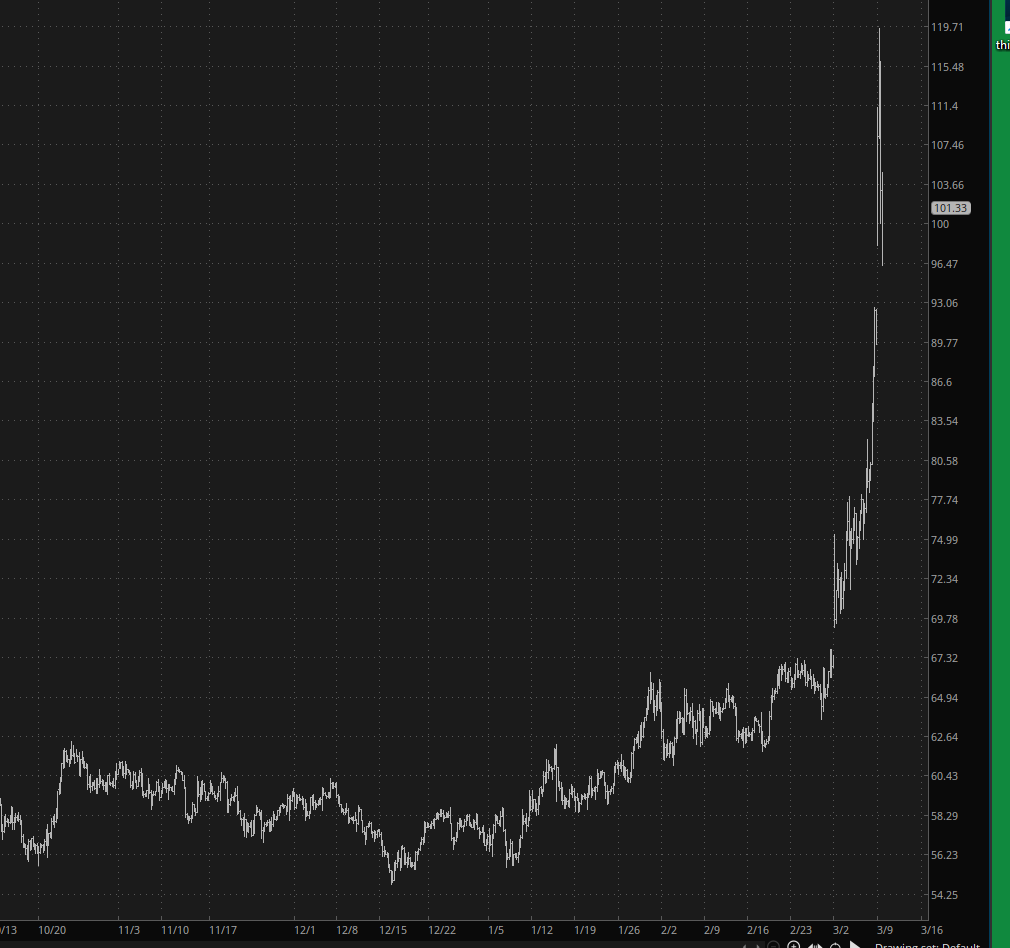
As is so often the case with thrilling Sunday night action, by the time we wake up to see what Monday holds, the movement is wholly or partly gone. For example, crude oil last night was on an absolute tear, moving up to about $120:
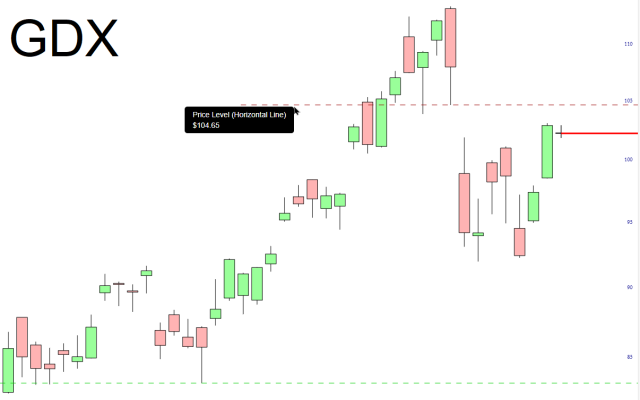
Just a heads-up that gold miners are quite close to their price gaps, which could represent key resistance.
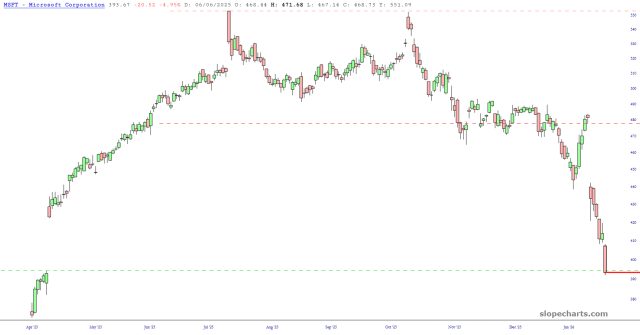
One would have never guessed that a price gap this large and left this far in the dust would be filled, but there you have it: it had to lose nearly 30% of its value to get there, but it did so:
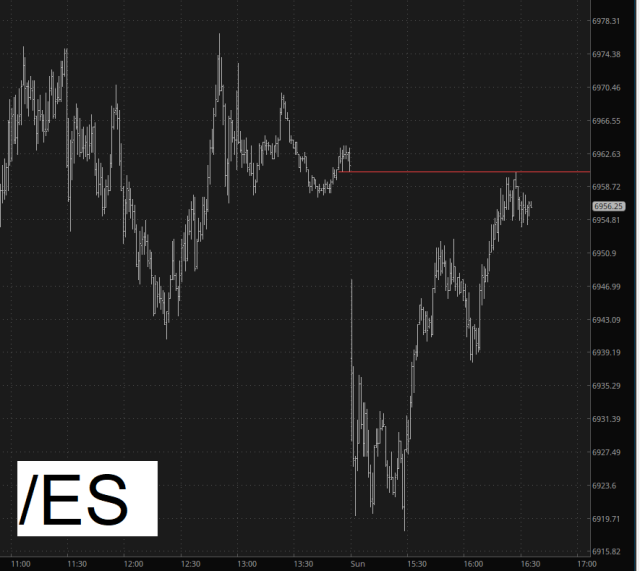
Well, the futures were off to an exciting start at first, with the /NQ plunging nearly three hundred points. Yet now, not even two hours into the session, with have a green /RTY, a green /YM, and an /ES down as of this moment a few hundredths of a single percent. Some crash, eh?
I just wanted to do a very quick post showing how the gaps were swiftly filled. They were actually filled to the PENNY, which was picture perfect for a few minutes, but since then prices have even pushed above the gaps (but, so far, only by a little bit).