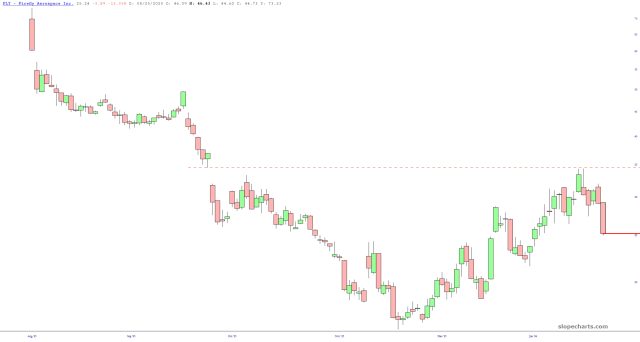
This all the mayhem around rocket stocks, I was tempted to short Firefly Aerospace (FLY) last week based on nothing but its price gap. I confess, I just couldn’t get up the courage. What a shame! Look at that hard reversal.
Slope initially began as a blog, so this is where most of the website’s content resides. Here we have tens of thousands of posts dating back over a decade. These are listed in reverse chronological order. Click on any category icon below to see posts tagged with that particular subject, or click on a word in the category cloud on the right side of the screen for more specific choices.
This all the mayhem around rocket stocks, I was tempted to short Firefly Aerospace (FLY) last week based on nothing but its price gap. I confess, I just couldn’t get up the courage. What a shame! Look at that hard reversal.
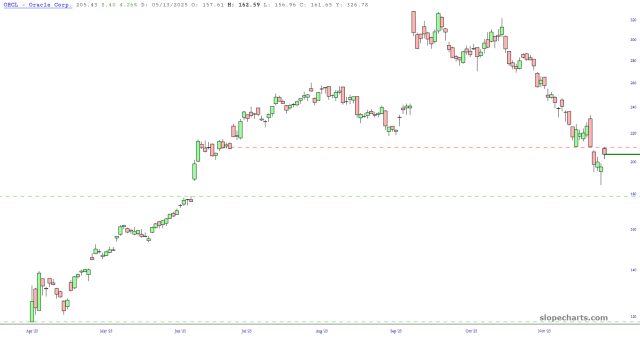
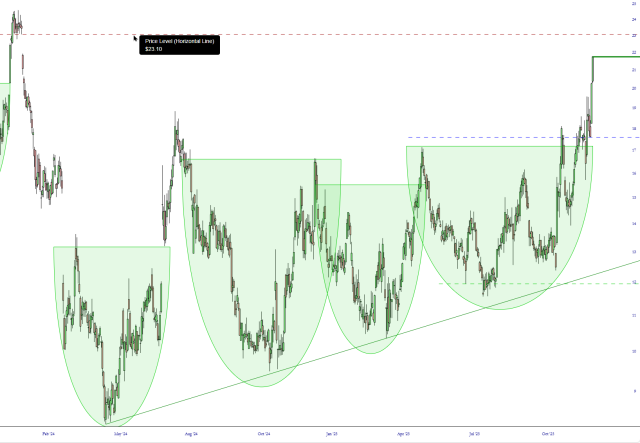
My RIVN long is doing dandy, but I wanted to at least give a heads-up to an important resistance point in the form of a price gap formed between the last day of 2023 and the first day of 2024 at $23.10. To me, that seems like a good price target (or just below it).
With all the sloshing and swishing throughout the day, when it was all over, the S&P 500 futures closed up 0.07%. Whoop-de-freakin’ ding-dang-doo. Good Lord, this market has become dull.
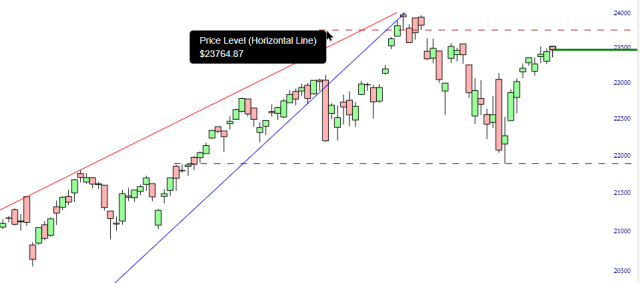
With that dazzling introduction, as we await the FOMC in 3.5 more trading days, below are some key U.S. stock indexes and, important, their key resistance levels. It would make things a lot more pleasant with the bears if these resistance levels were respected and not exceeded. Here, close up, is the NASDAQ Composite:
The market started off down hard this morning yet as is so often the case, buyers are pushing their way forward, trying to reverse the tide. Let’s take a moment to hone in one something specific, however: precious metals.
Silver has had, shall we say, a spectacular year. Once more, the metal has reached a new lifetime high (nominally speaking, of course).

One can’t help but wonder if the next leg down is imminent…………..