
Slope of Hope Blog Posts
Slope initially began as a blog, so this is where most of the website’s content resides. Here we have tens of thousands of posts dating back over a decade. These are listed in reverse chronological order. Click on any category icon below to see posts tagged with that particular subject, or click on a word in the category cloud on the right side of the screen for more specific choices.
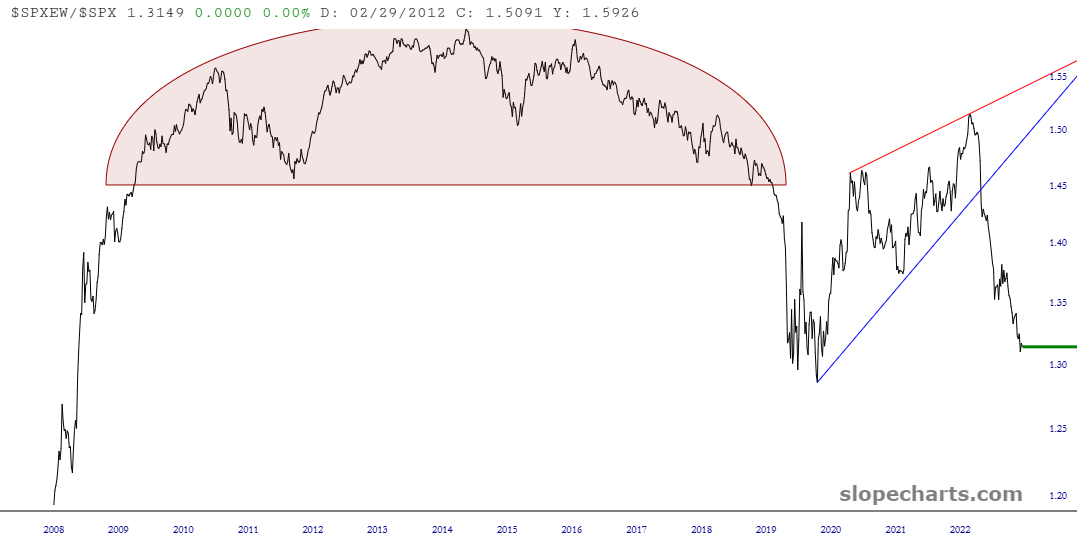
Foul Breadth
Lest you become convinced by the mainstream media that the market is healthy, kindly observe that the equal-weighted S&P 500 divided by the regular, megacap-heavy S&P 500, continues to collapse into oblivion. In other words, the “magnificent seven” are doing ALL the heavy lifting and are hiding the true weakness in most equities.
At Last! Smart Moving Averages…..
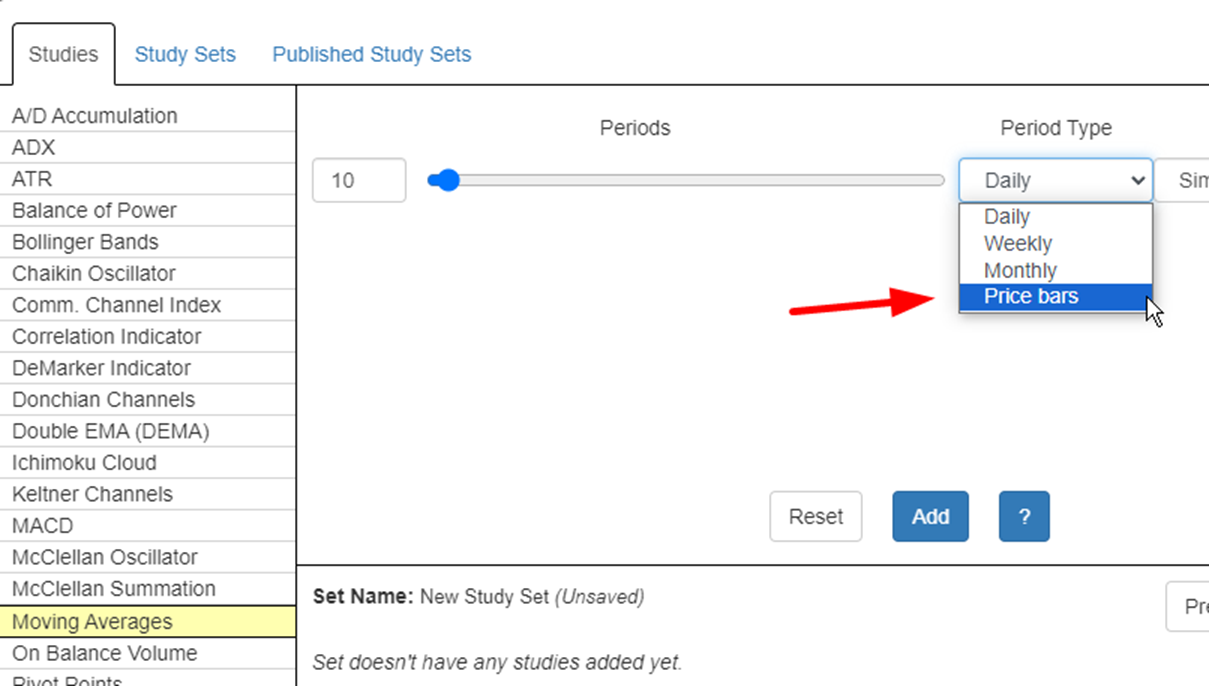
There is no improvement to SlopeCharts that has been more requested than this one, and after literally years, I finally got around to making it happen: specifically, what we’ve done is make moving averages “smart” so that as you change granularities (daily to weekly to monthly or what have you) them the moving average will change itself to conform to your new granularity. This sounds really obscure, but trust me, people have been howling for this!
Here is the change to the dialog box we’ve made:
An Oversold Industrial Insiders Are Buying

Summation Arguments (by LZ)
The A/D summation indexes all sport topping patterns and surprisingly, the big cap is the most damaged. Below are shown the summation indexes for small-cap, mid-cap, and large-cap stocks:

