It’s the happy-go-lucky 3 Amigos (in play since we began this goofy metaphor last fall), which would signal macro changes to come. When you are talking about the macro however, things move slowly and to date, only one of our riders has made it to his destination.
To review, they are Amigos 1-3, Chevy, Steve, and Martin.
- Stocks vs. Gold
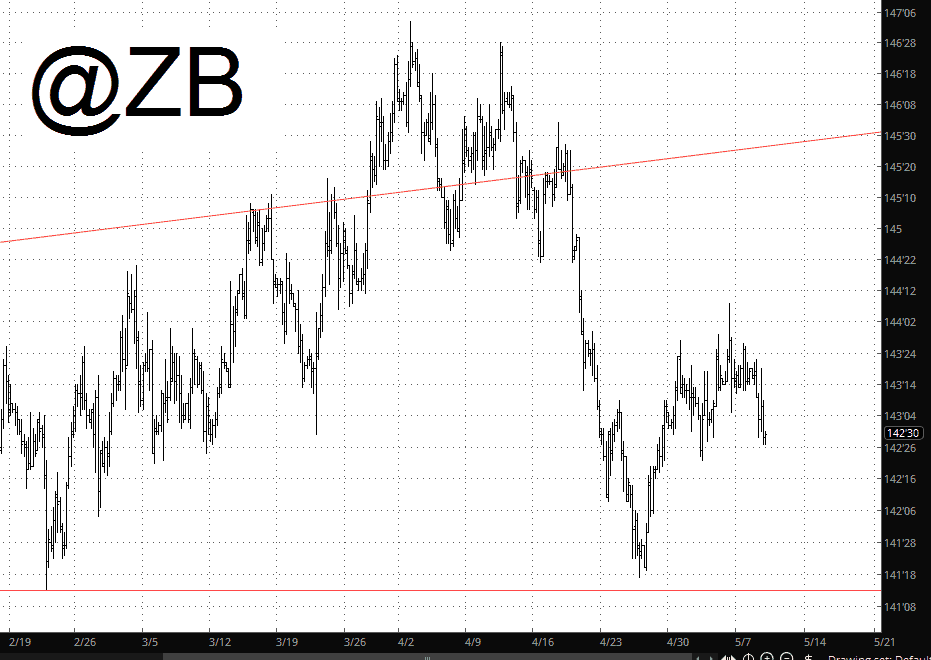
- 10yr & 30yr Yields
- The 10yr-2yr Yield Curve
Below we’ll review a daily (short-term) and monthly (long-term) chart of each to check the status.

Amigo #1: Stocks vs. Gold
We noted Amigo #1’s eyes closed as stocks vs. gold took a big plunge in early February and again in March. This has actually set a lower highs, lower lows downtrend in 2018, and the swings have been very dynamic. Right now we are on an up swing and if you are a gold bug and this ratio rises above the March high please prepare to take caution, as the macro would be moving against you, at least relative to risk ‘on’ assets. But for now the lower highs and lower lows daily trend is intact. (more…)