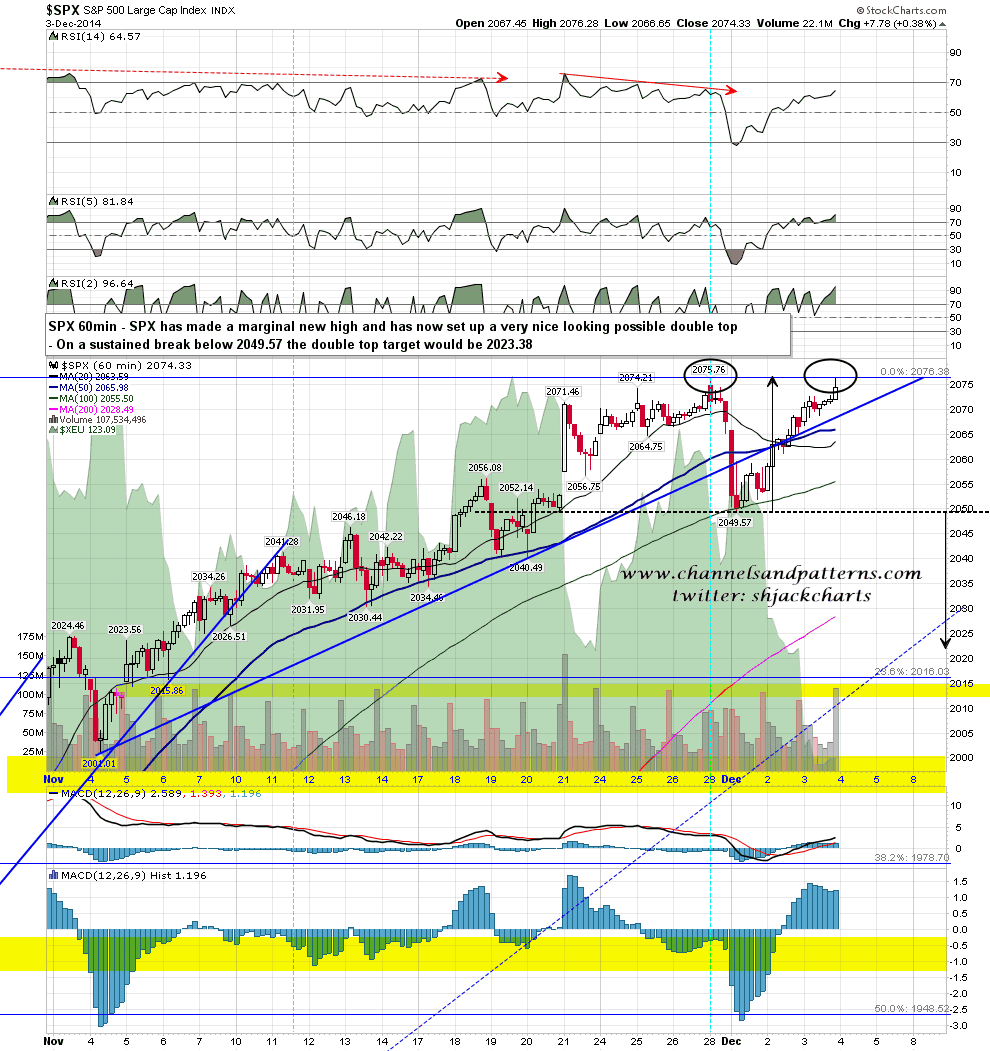
SPX made a marginal new all time high yesterday and the odds against the bulls on the historical 5 DMA run stats improved in their favor, as only three of the previous five examples returned to make a new high. Two of those still failed at that marginal new high however, and if we should see failure again here then there is now a very nice looking double top setup that would target the 2023 area on a sustained break below Monday’s low at 2049. SPX 60min chart:
Slope of Hope Blog Posts
Slope initially began as a blog, so this is where most of the website’s content resides. Here we have tens of thousands of posts dating back over a decade. These are listed in reverse chronological order. Click on any category icon below to see posts tagged with that particular subject, or click on a word in the category cloud on the right side of the screen for more specific choices.
It Can Always Be Different This Time (But Usually Isn’t)
I wasn’t looking for the strong rally yesterday but I had mentioned in my posts on both Monday and Tuesday the possibility that the current high might be retested to make the second high of a double top, and that is what we should be looking at here. A lot of people were assuming that the retrace was complete yesterday evening but it’s too early to say that, and the historical odds are still stacked against that outcome here.
The reason for that is in part the SPX daily sell signal that triggered on Monday, which has an impressive track record, but is even more so on the historical performance after the break of the five 20+ day runs above the 5 DMA since 1961, and after a close look this morning the stats for these are below: (more…)
Unquenchable Exuberance
SPX closed above the 5 day MA yesterday and that took the number of consecutive closes above the 5 DMA to 27, which is a record as far back as my decent daily data goes back to the end of 1961. I was saying yesterday that this might be an all time record and Zero Hedge posted an article after the close yesterday confirming that, and adding that it equals a 27 day run in 1928. If we see another close above today then that would beat even that into a new SPX lifetime record.
There have been five previous runs of 20 or more closes above the 5 DMA going back to the end of 1961, and I’ve noted the stats on all of those for what happened after the end of the run in the short term, and also what happened over the next year. Those stats are on the chart but in summary the end led into a retracement of between 2% and 7% with the median retrace at 3.5%, and all of the previous five were up over the following twelve months, though as Tyler Durden noted, that wasn’t the case in the case of the run in 1928. Even in that case however the market doubled again before it halved, so regardless history is telling us to expect more upside after some retracement. SPX daily 5 DMA chart: (more…)
View From Far Above
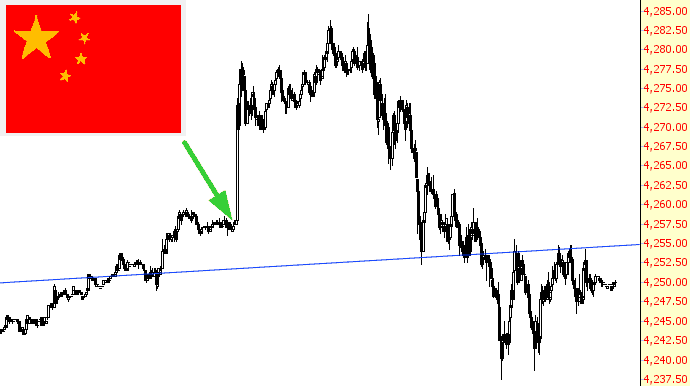
As the entire world knows by now, China joined the rest of the world’s central banks in more “easing”, which sent markets into a spastic move higher. As you can see by this view of the NQ, this massively bullish news has not, as of yet, represented any kind of sea-change in the markets. Before the day was even out (again, in some, not all markets), the entire move up was reversed.
Here There Be Dragons
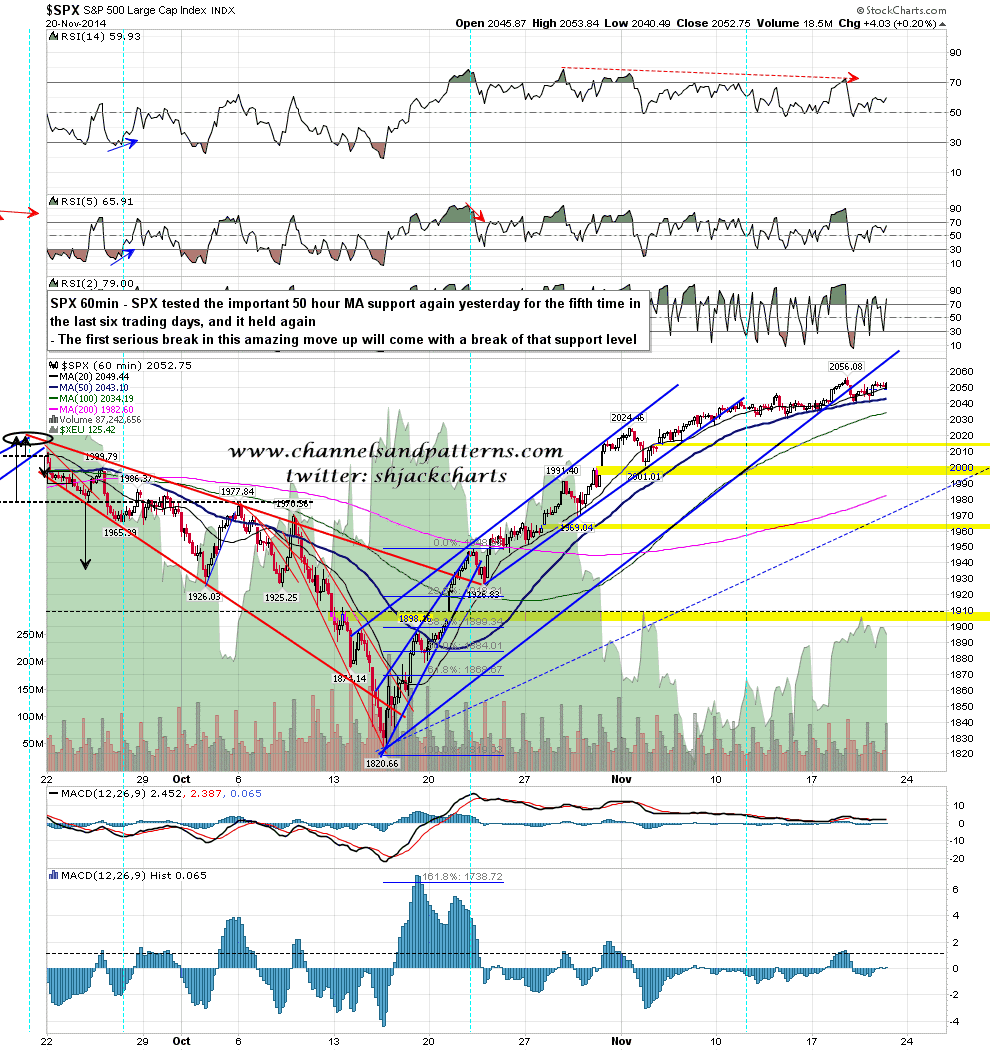
Yesterday morning ES tested the weekly pivot at 2035.5, and then SPX tested the 50 hour MA and then SPX was off to the races again. That 50 hour MA has held on five tests out of the last six trading days and until we see a break below it this uptrend is still very much intact. That first break below would normally also precede the main high, so that main high still doesn’t look close here. SPX 60min chart: