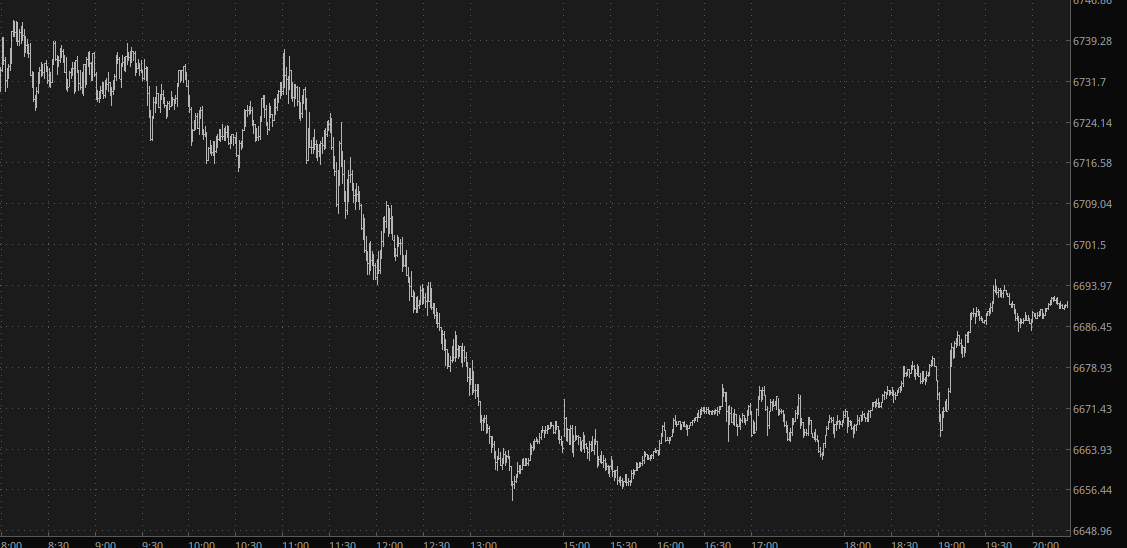
Slope initially began as a blog, so this is where most of the website’s content resides. Here we have tens of thousands of posts dating back over a decade. These are listed in reverse chronological order. Click on any category icon below to see posts tagged with that particular subject, or click on a word in the category cloud on the right side of the screen for more specific choices.
I trust everyone is having a good long weekend. Let’s take a look at some major U.S. cash index charts.
First up is the NASDAQ Composite. My spidey sense is that we are going to break below that range before this month is over, which should set off a handsome sell-offf.
I reduced my exposure earlier today to a mere 68% and am watching from a safe distance as people fall all over themselves to buy equities. Don’t be so sure this is wise. The nature of the market has changed. I’d just rather not be overly exposed in front of a three-day weekend.
As with last week, I had a couple of fantastic back-to-back days. Each of them started off looking bad, then as the day wore on it just got better and better. I can only hope that, unlike last week, it doesn’t all get undone with some mega-rally on Friday.
The Dow Industrials slipped hundreds of points under the psychologically important 50,000 (or, if you’re Pam Bondi, 50,000 dollar) level. Happy as I am with this drop, nothing has changed with this index. The ascent has been smooth as silk, and the trio of exponential moving averages I’m using on all these charts is just about as steady as one could hope.
Monday.com (MNDY) is a train wreck. It is down about 84% from its peak (and remember, that’s down 84% in the most overvalued bull market in human history) and now, at lifetime lows, there’s nothing holding it up between here and $0 except for company bromides. I wish I could say I was short this beast but………..wow.