As with last week, I had a couple of fantastic back-to-back days. Each of them started off looking bad, then as the day wore on it just got better and better. I can only hope that, unlike last week, it doesn’t all get undone with some mega-rally on Friday.
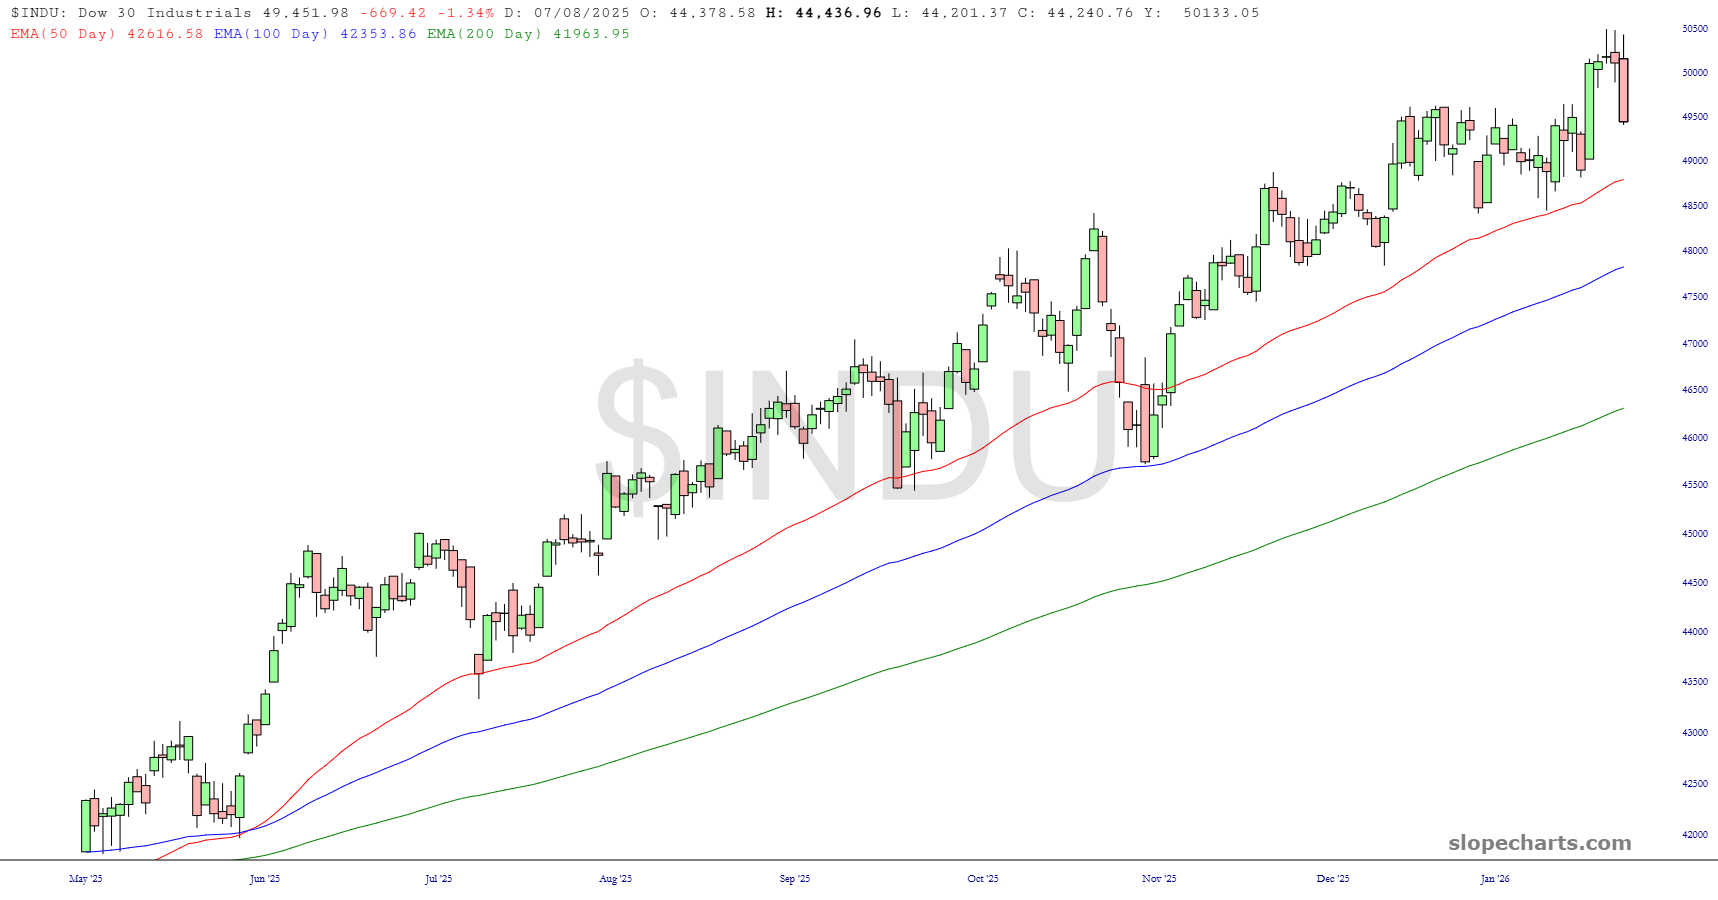
The Dow Industrials slipped hundreds of points under the psychologically important 50,000 (or, if you’re Pam Bondi, 50,000 dollar) level. Happy as I am with this drop, nothing has changed with this index. The ascent has been smooth as silk, and the trio of exponential moving averages I’m using on all these charts is just about as steady as one could hope.
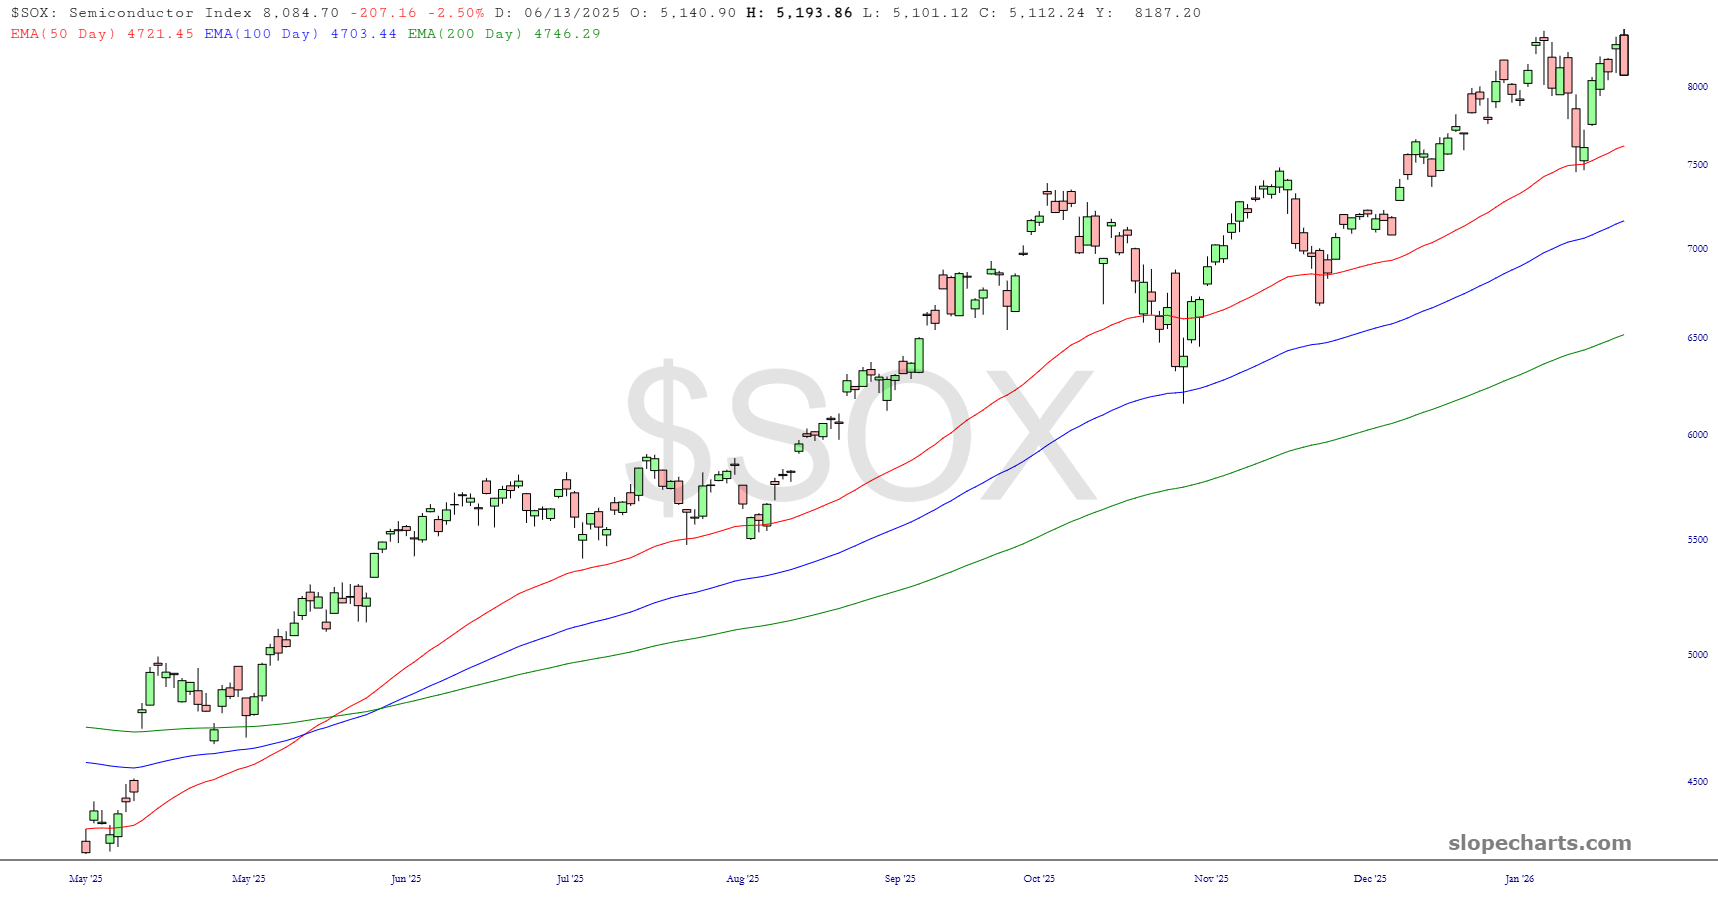
Semiconductors likewise had a drop today but the EMAs are well-spaced apart and it’s going to take a lot more damage than just today to really break this index.
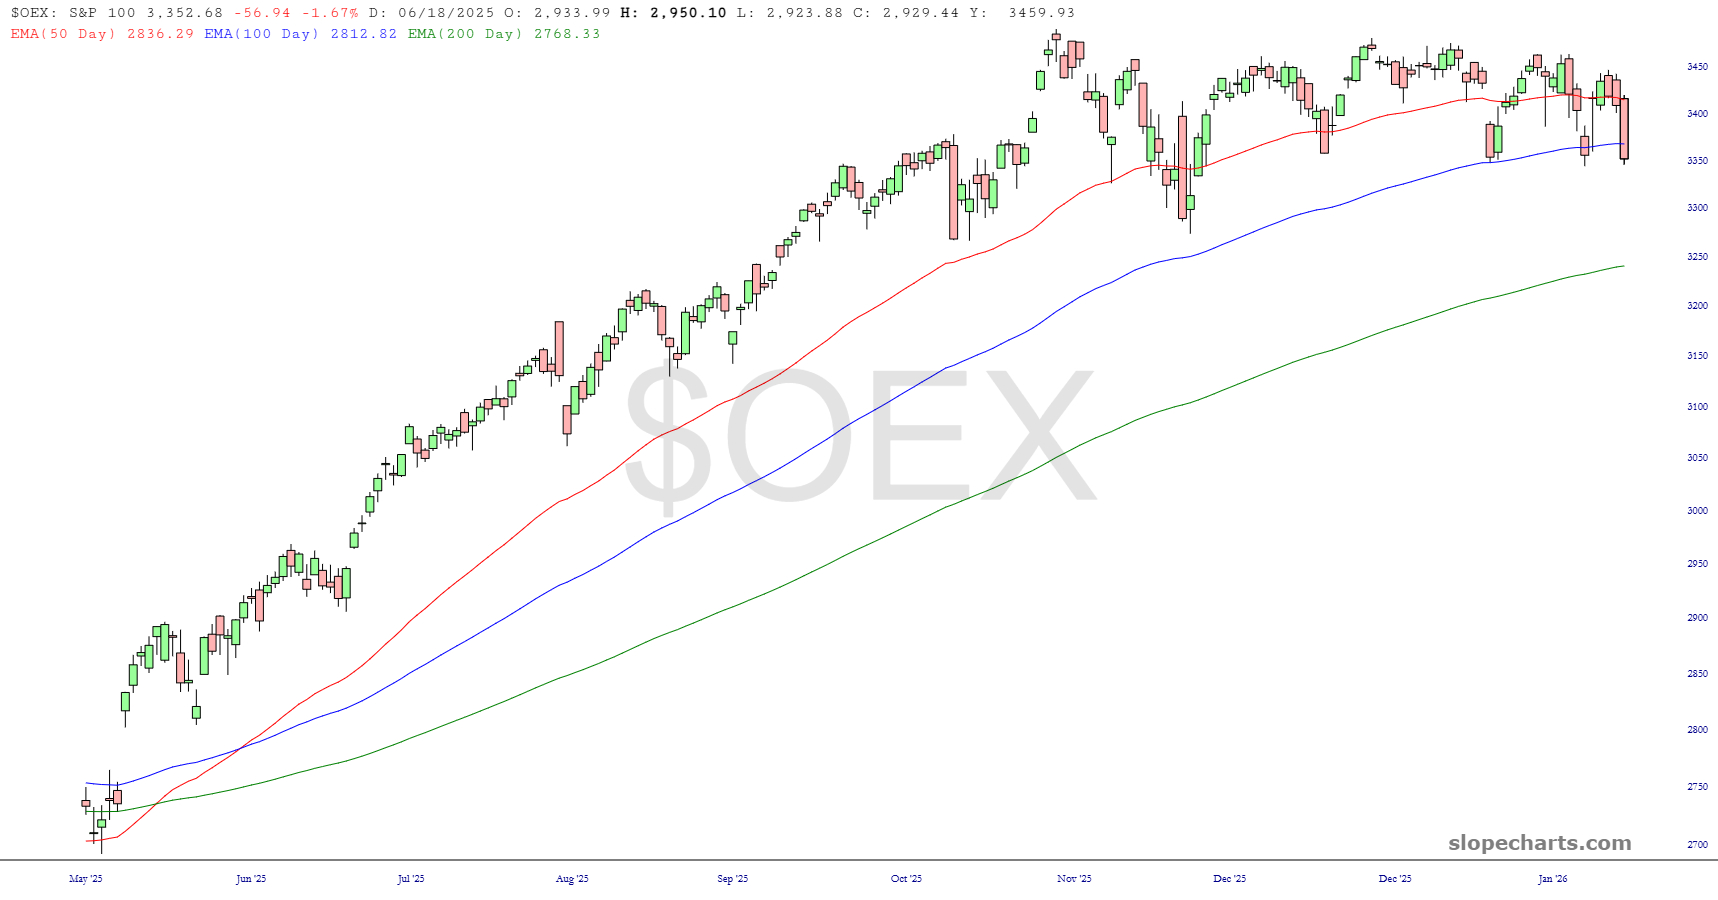
For the bears, things are looking more encouraging elsewhere. The S&P 100 has slumped to its 100-day EMA three times in the past few weeks, and if it stays weak like this, I can picture the 50-day cutting under the 100-day. As you can see, this index hasn’t made any net progress for literally months.
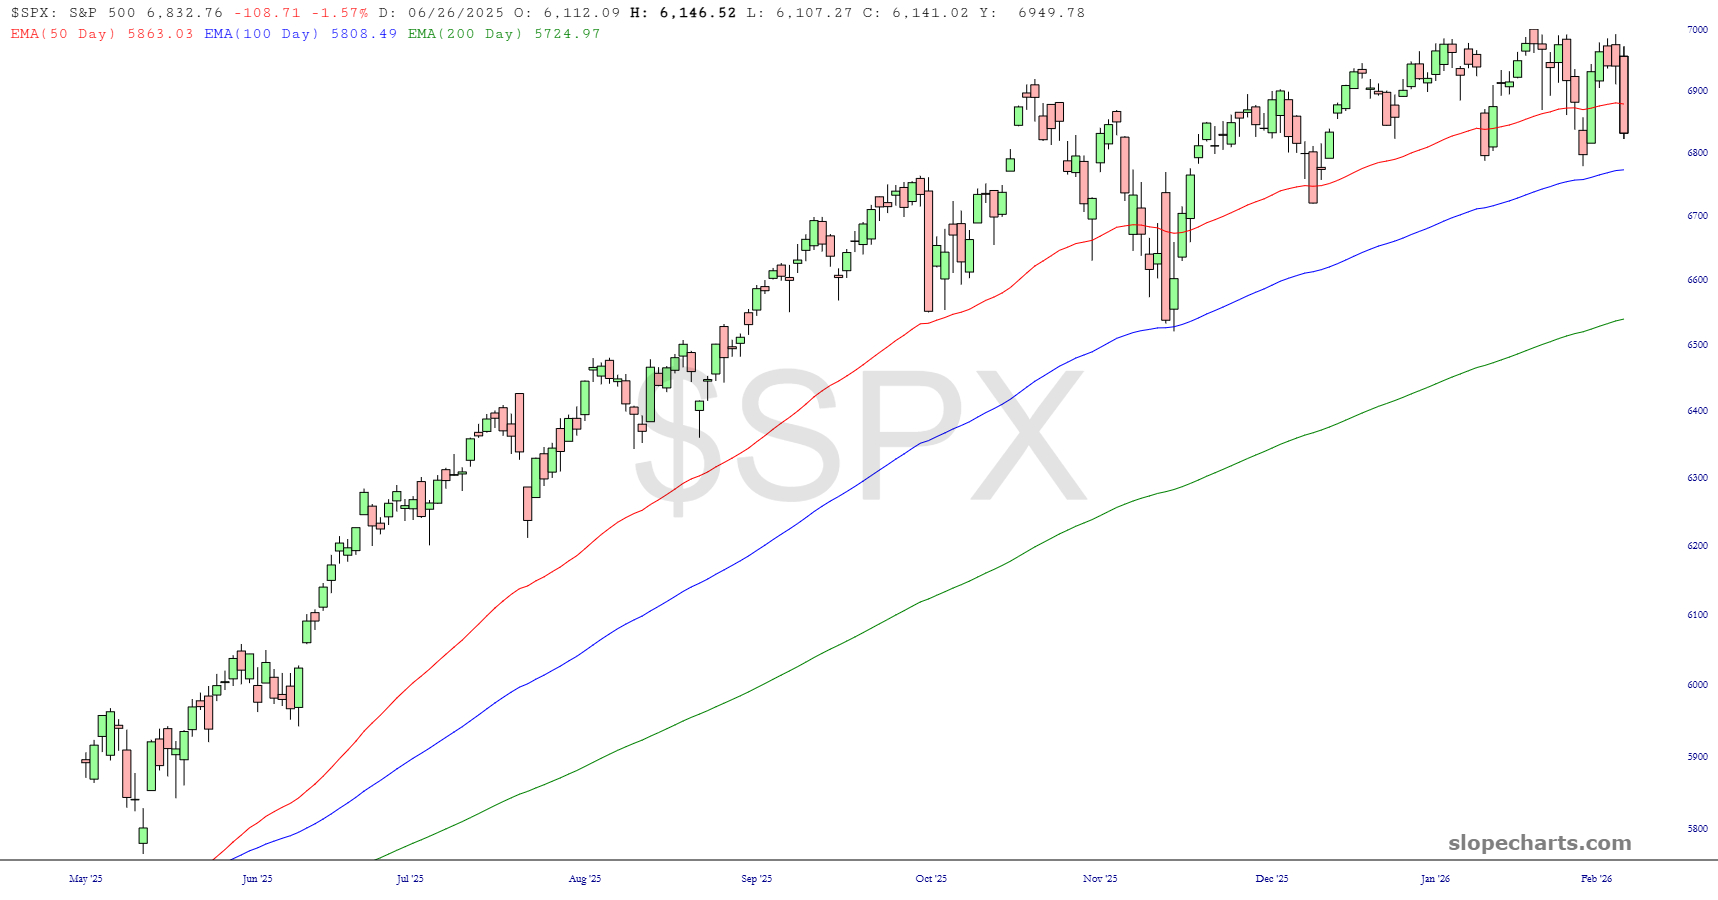
All that was just said about the S&P 100 can be applied to the 500. This has morphed from a firmly ascending market to a sideways range-bound market. I have also, as a person who likes shorting individual equities, done well with what has clearly proved to be a great stock-picker’s market
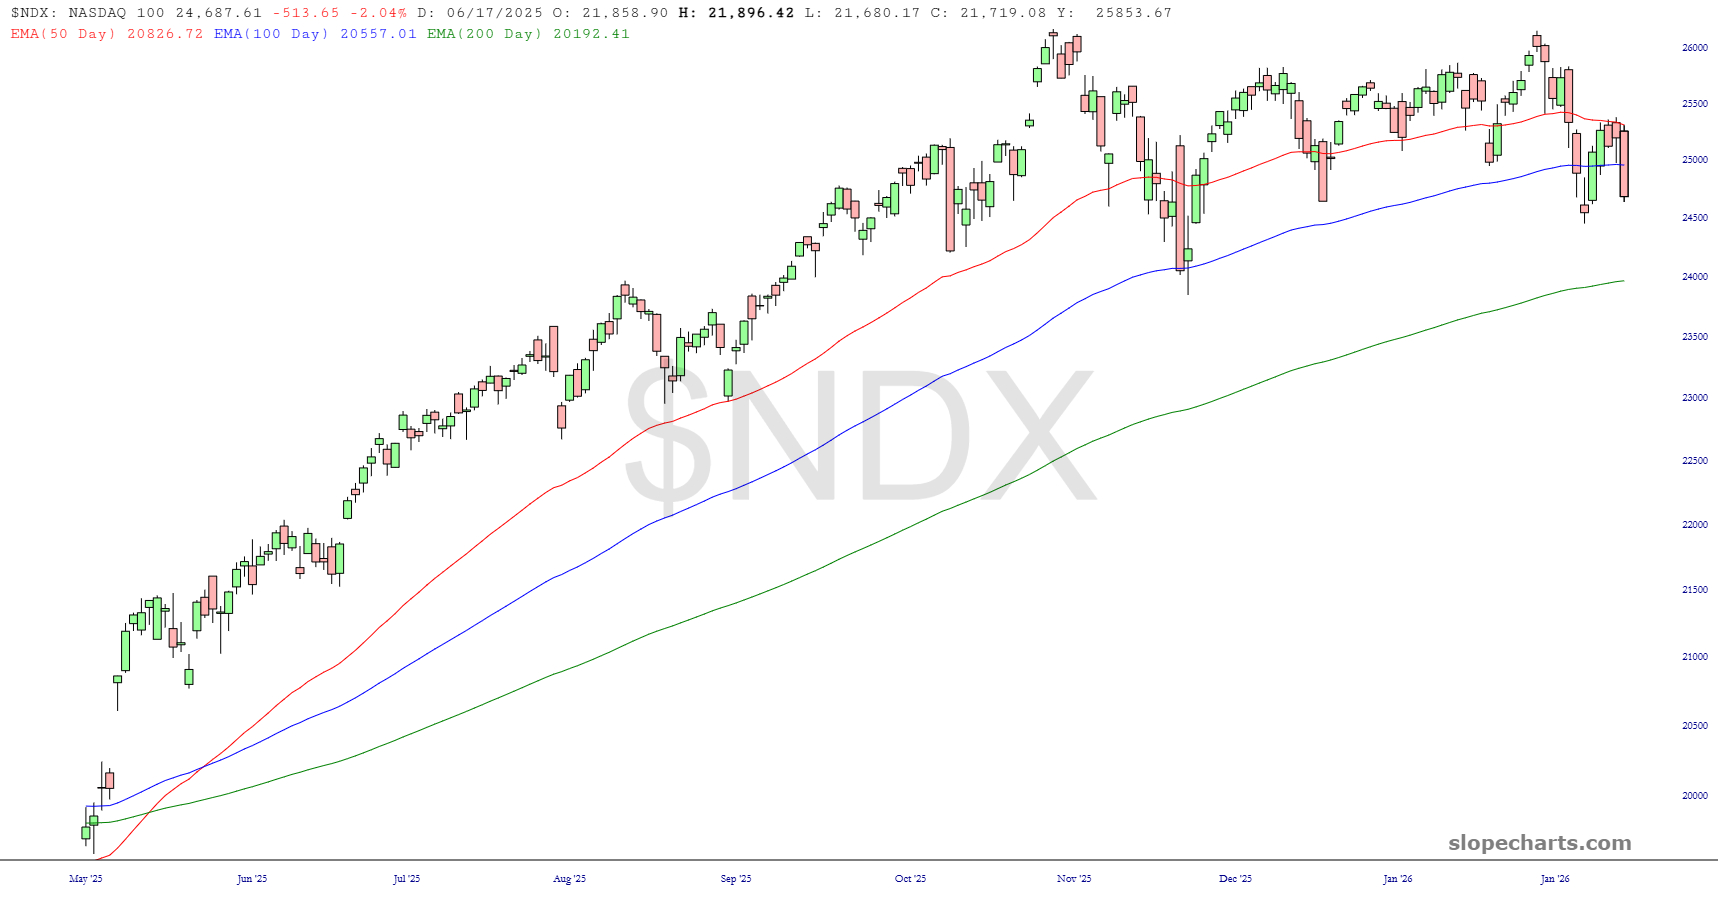
The situation is even better for the bears in tech-land. Indexes are at the same prices they were in freakin’ September, and you can plainly see how this market is curving its way to what could be an impressive top. I would also note this is the first close below the 100-day EMA for ten months.
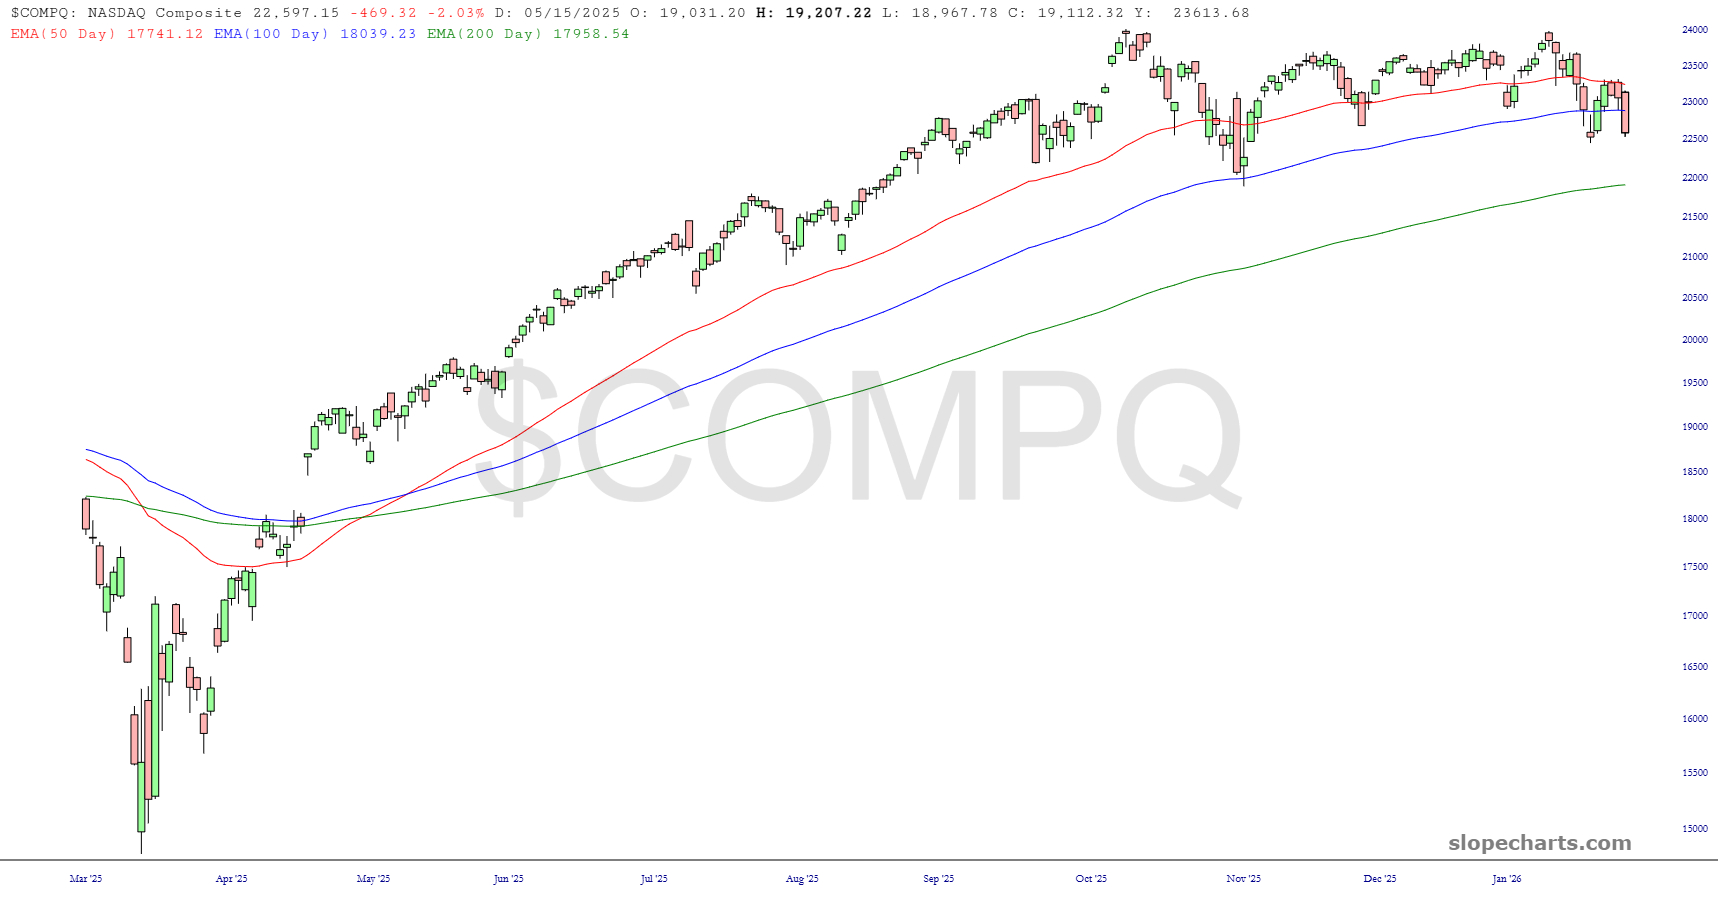
You can see the same loss of energy with the much broader NASDAQ Composite.
In general, it was a tremendous day. I’m going to go through a bunch more charts now. Here’s a live Tim-cam of me getting ready for my evening analysis, accompanied by the intrepid Mishka.