
Looking at SPX/gold again yesterday I realized…that looks a lot like Bitcoin doesn’t it?
Sure enough. The two have behaved similarly over the past 10 months or so, going back to the Time of the Tariff Tantrum Tribulations.
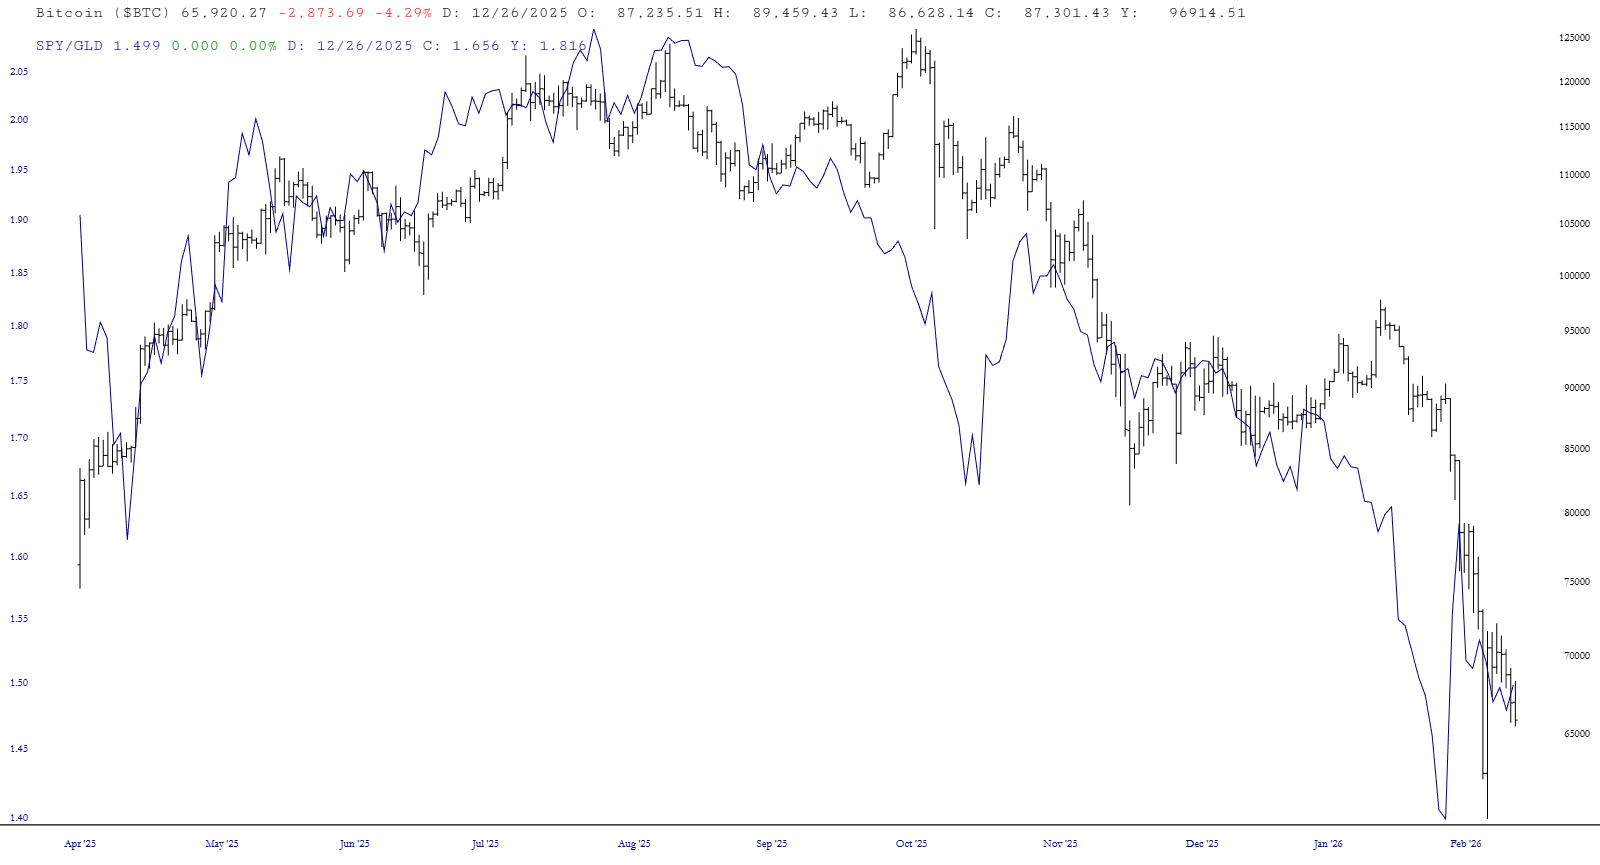
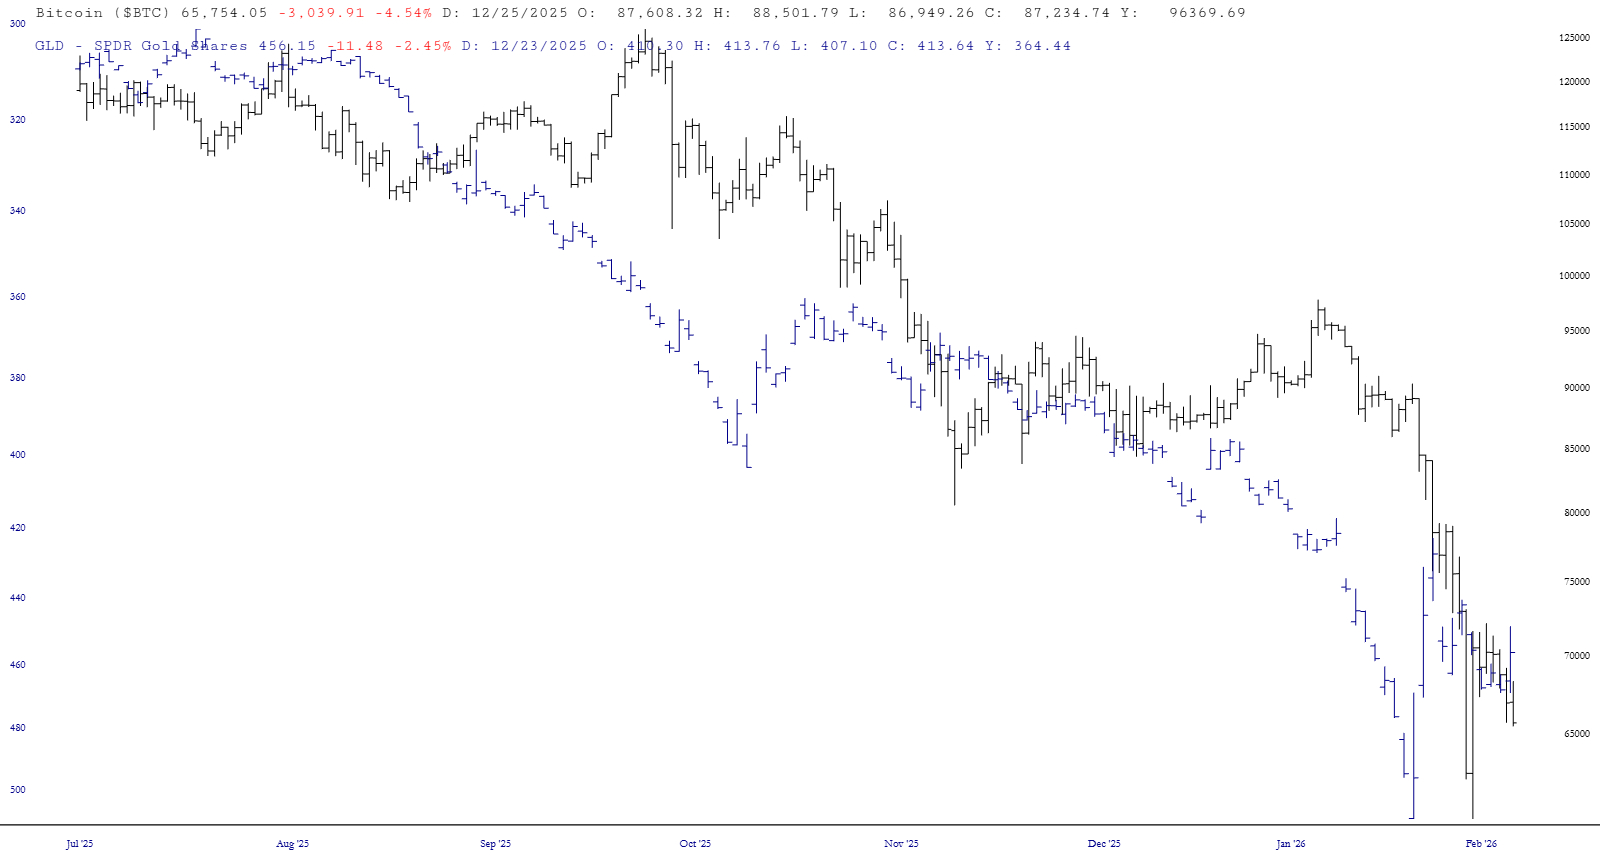
Maybe it’s an anomaly and the similarity ends. Maybe it’s just Bitcoin acting like inverse gold as speculators dump digital not-gold for the real thing.
Maybe Bitcoin is just software.
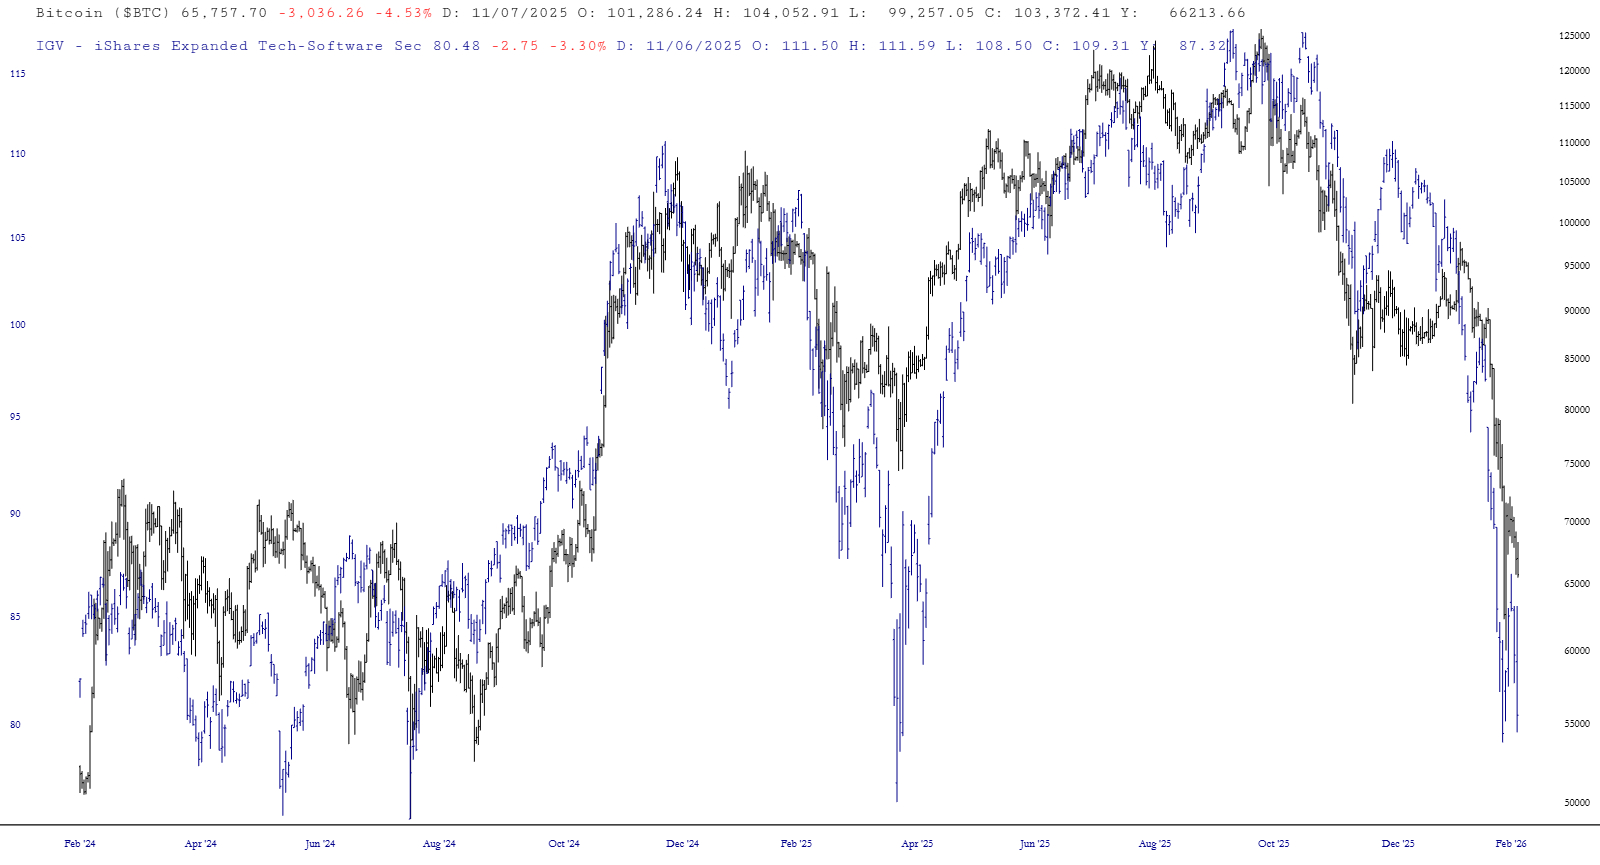
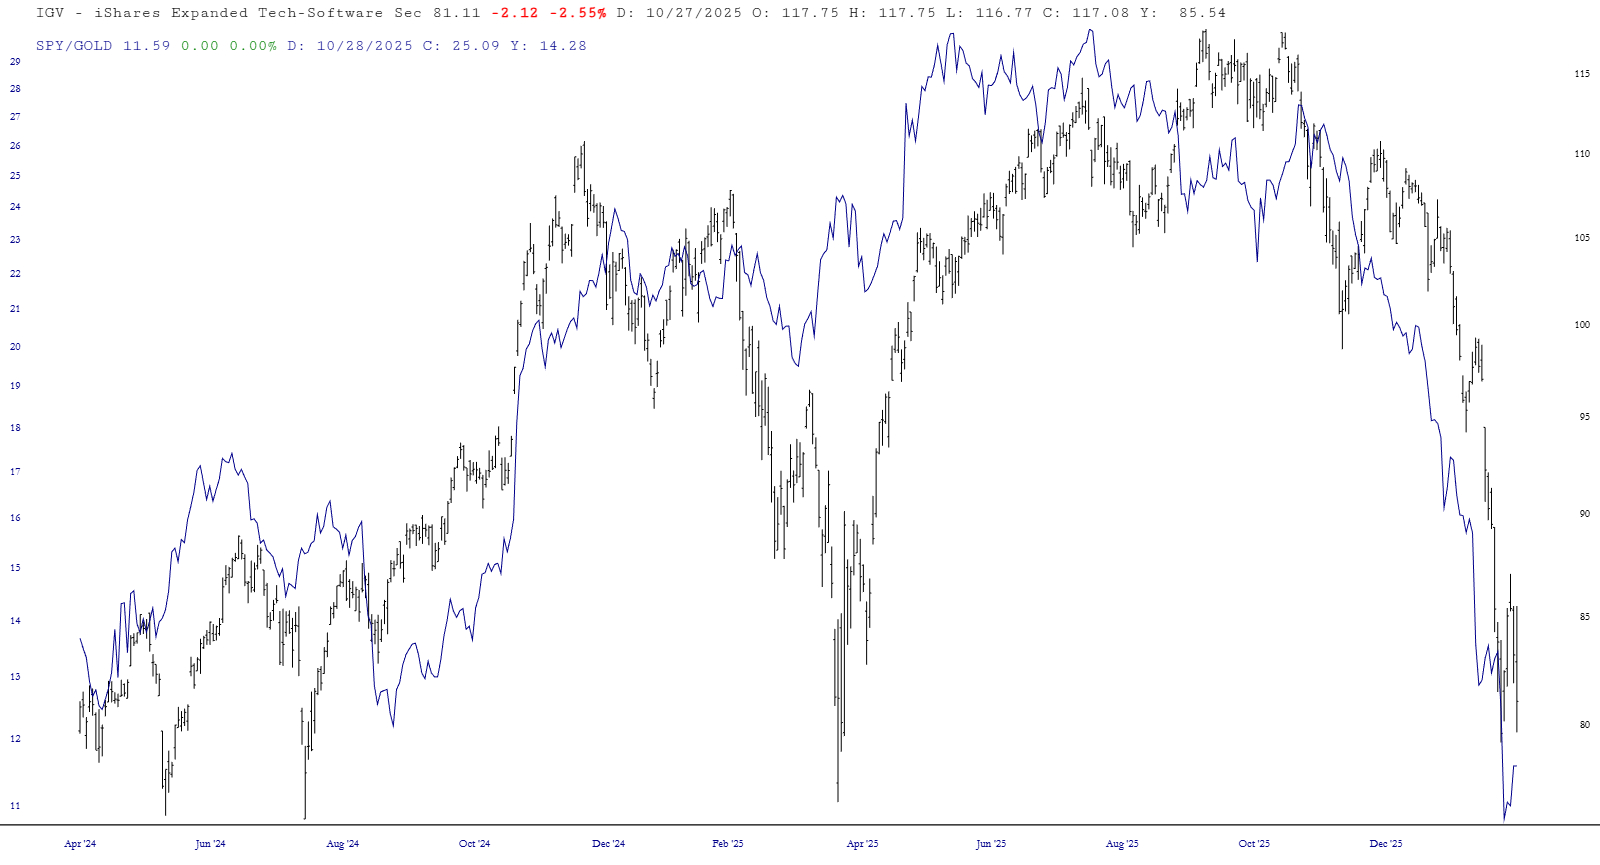
While Bitcoin definitely looks more like IGV, the software ETF still looks similar enough to SPY/GLD to make me wonder about the underlying cause. I can’t see one off hand other than the AI story, but the AI story doesn’t make sense for SPY/GLD.
Or maybe Bitcoin is the premier risk asset, and its decline has more to do with changing risk appetites.
If that’s that case, what’s the worst-case interpretation and scenario for the market?
One, the charts signal rising risk aversion and two, gold has stopped going up for now.
If that combination plays out as Bitcoin continues selling off, the charts keep matching if the S&P 500 starts trading more like Bitcoin.
Both the Bitcoin chart and here SPX/GC charts have similar resistance levels on their charts, and both tested those areas during last week’s rebound.
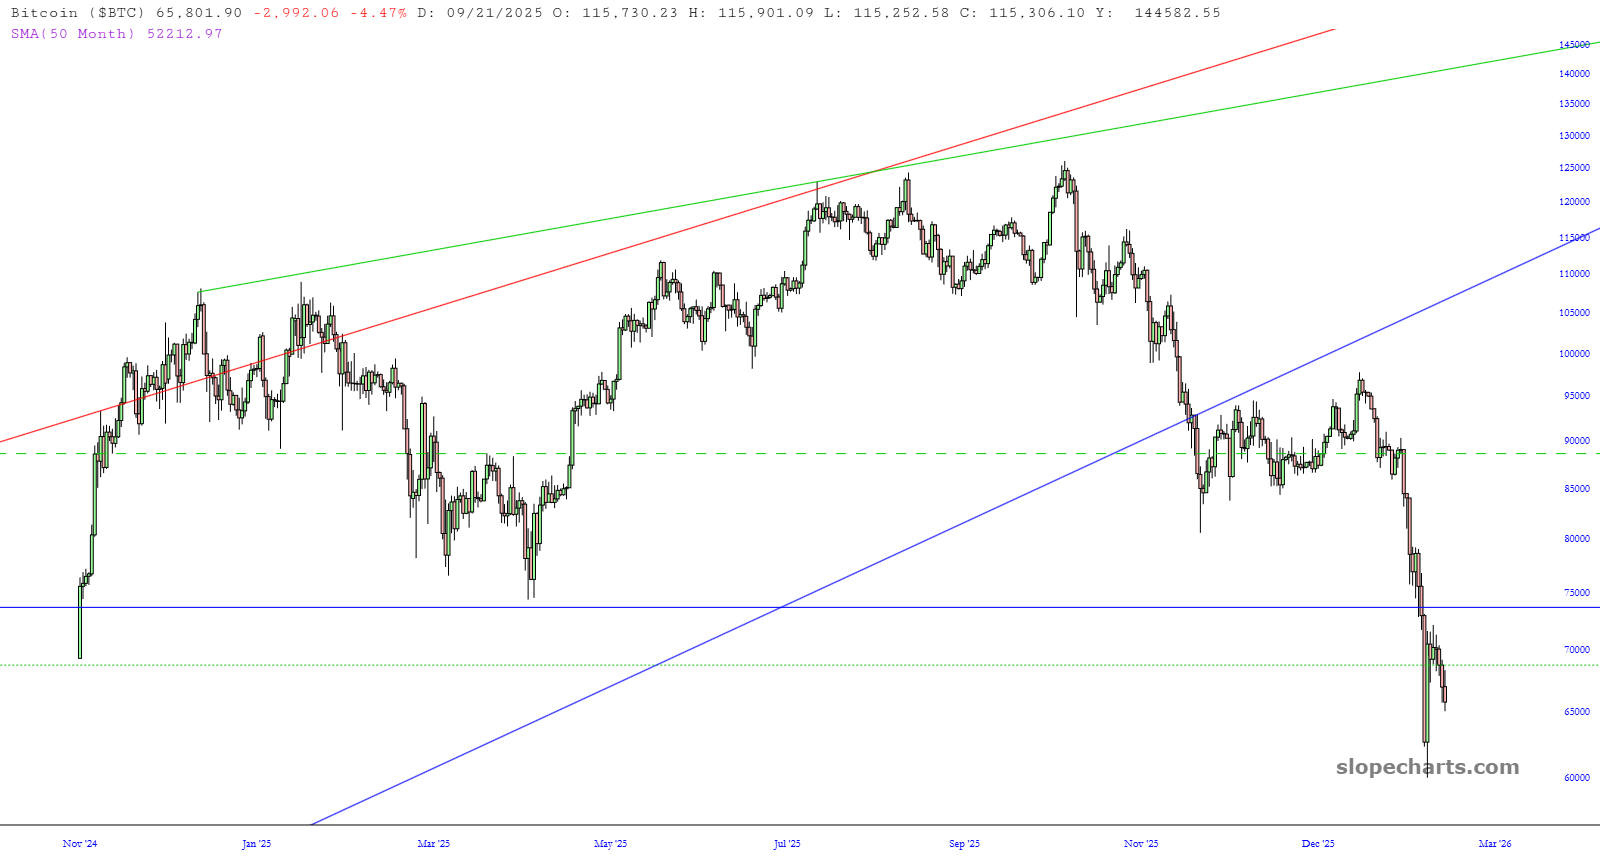
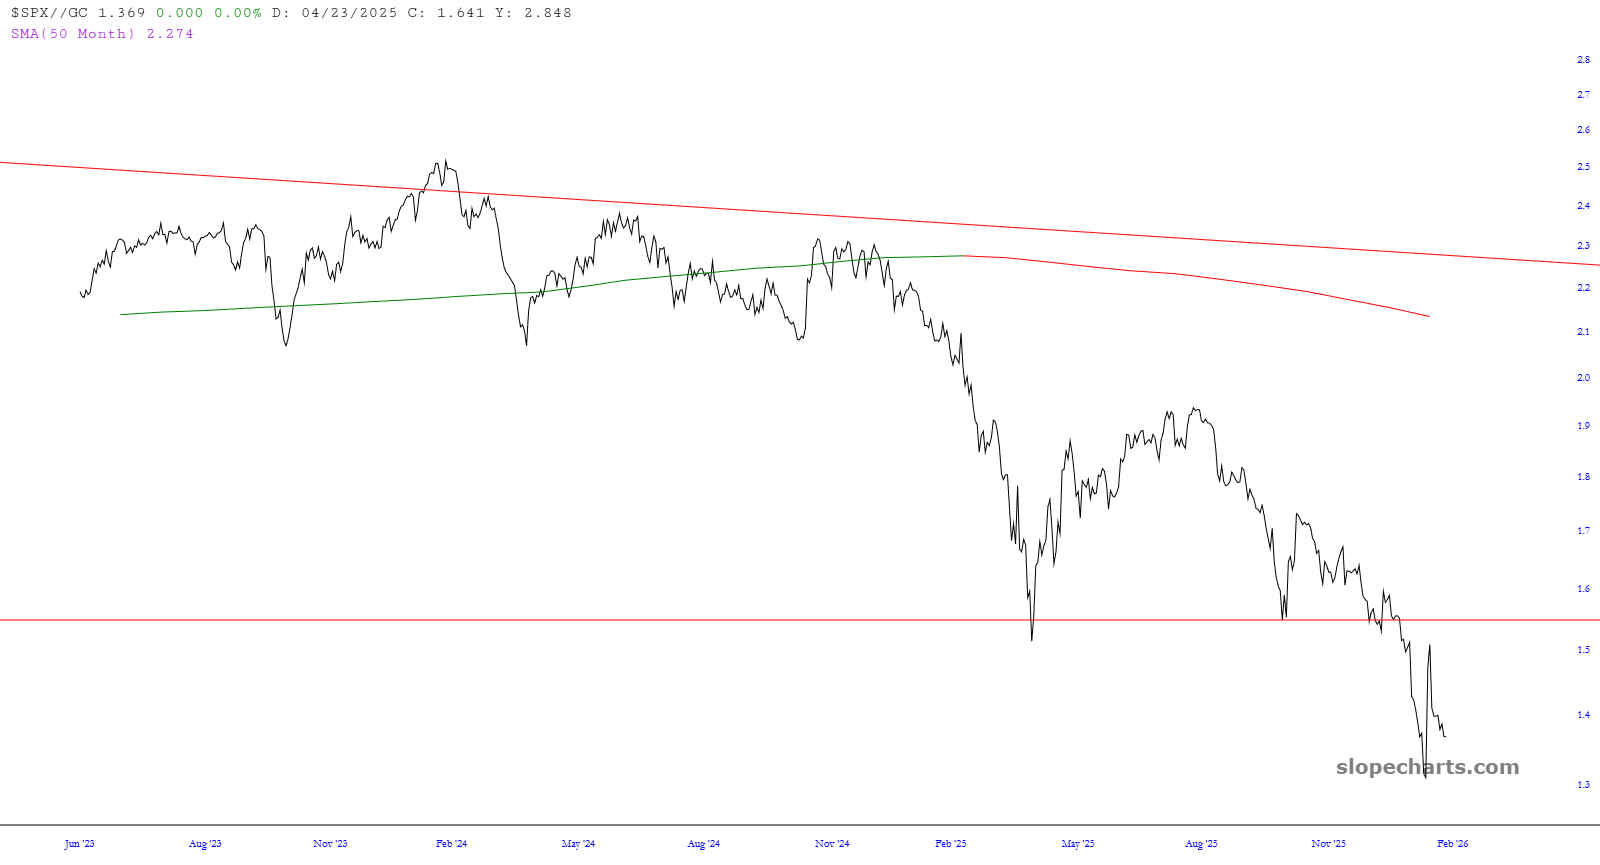
Both charts should still move in the same direction in the near-term. Bulls want to see gold down, SPX and Bitcoin up. Bears don’t necessarily care about gold, but if gold was flat or falling and SPX/gold still looked like a plunging Bitcoin, it would mean SPX is doing all the work of driving that ratio lower.
