Below is a new video packed with charts and analysis. All paying members can watch it and, hopefully, profit. If you would like instant access, please join any level of Slope Premium by clicking here.
Slope of Hope Blog Posts
Slope initially began as a blog, so this is where most of the website’s content resides. Here we have tens of thousands of posts dating back over a decade. These are listed in reverse chronological order. Click on any category icon below to see posts tagged with that particular subject, or click on a word in the category cloud on the right side of the screen for more specific choices.
See You in Valhalla!
Dukie decided it was crucial to chew on a squeaky toy from 3 to 4 this morning, so my rigid morning routine got somewhat effected, as I got out of bed at the unconscionable time of 6:40 a.m. At least I woke up to this important announcement, which I’ve been waiting years to see:

Golden Spike
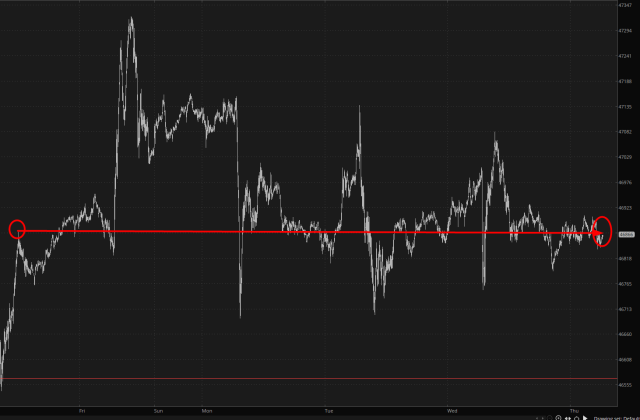
Equities continue to go absolutely nowhere. Here’s the /YM for the past week. Sure, there’s some smoke, but absolutely zero fire. It’s dead, Jim.
New Highs All Round
In my post on Friday 26th September I was putting the case that the modest retracement that we saw that week might well be over, and in my post on Monday 29th September I was outlining the still possible option that we might nonetheless see another leg down on US indices, though I was assigning that a low probability.
Equity indices resolved higher as expected, and we have seen new all time highs made last week on SPX, QQQ, DIA and IWM. My personal view is still that US equity indices are likely heading higher into the end of the year unless we start seeing strong breaks of the support at the daily middle bands that were backtested and held on SPX, DIA and IWM in the late September lows.
How will that be affected by the current government shutdown? Well that rather depends on how long it lasts, and the longer that lasts the more likely it is that we see equity markets weaken. Looking at the chart below there is a significant negative lean historically for these though I’d note that of the twenty government shutdowns listed on the chart below, the last five starting in Nov’ ‘95 all closed green, with a real outlier in the last one in December ‘18 which was the most bullish shutdown since 1976.
(more…)De Plane! De Plane!
No, Tattoo! It’s de-list, de-list! The quantity of public companies in the U.S. has been shrinking massively for years. In 1996, when Prophet was still a two-person company, there were over 8,000 stocks. These days, they are HALF that many, even with the economy vastly bigger than it was in those salad days.

