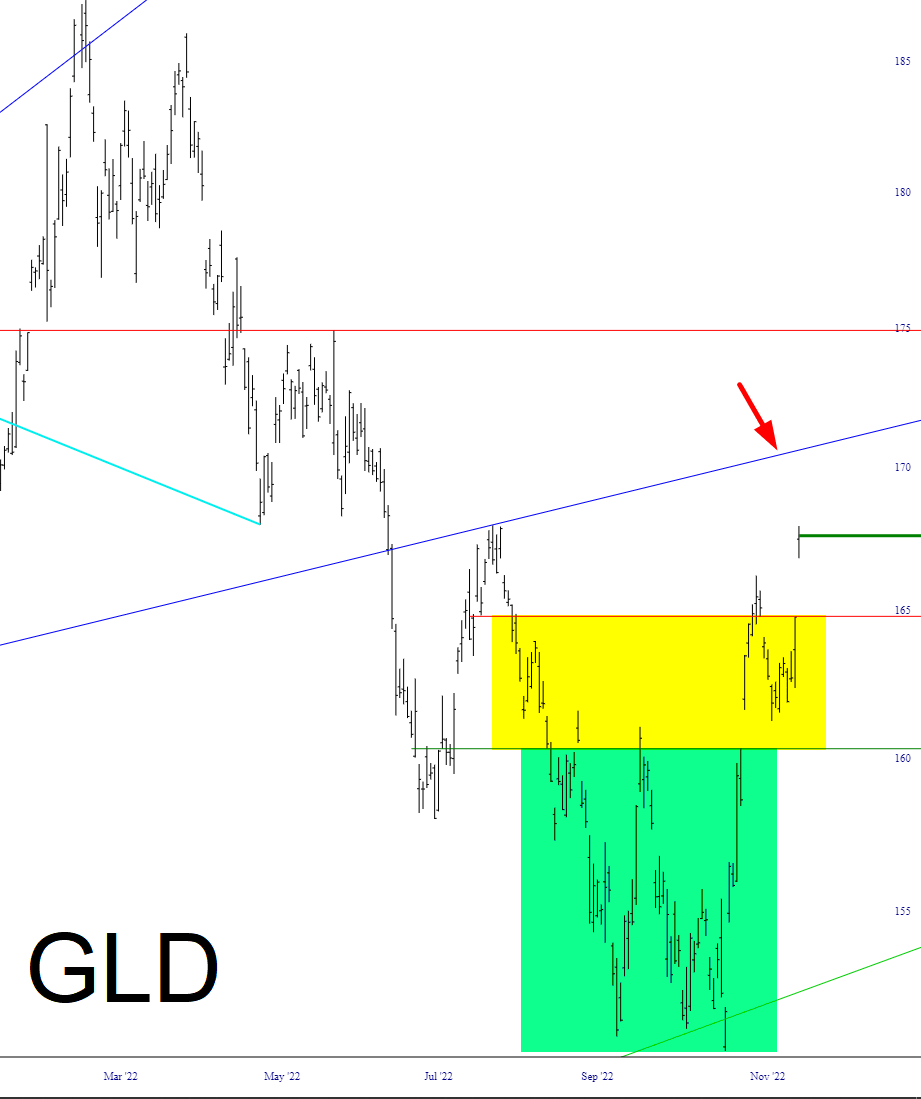
Precious metals reached escape velocity, fueled by the crumbling US dollar; that arrow marks, in my opinion, the highest target for GLD right now.
Slope initially began as a blog, so this is where most of the website’s content resides. Here we have tens of thousands of posts dating back over a decade. These are listed in reverse chronological order. Click on any category icon below to see posts tagged with that particular subject, or click on a word in the category cloud on the right side of the screen for more specific choices.
Precious metals reached escape velocity, fueled by the crumbling US dollar; that arrow marks, in my opinion, the highest target for GLD right now.
The risk/reward for gold stocks has been very good after 2.5 years of correction that, contrary to what a majority of gold bugs think, was very valid amid the post-pandemic cycle of cyclical inflation. I won’t review the details about why here, as it is beyond the scope of this article and I’ve parroted them in several blog posts at nftrh.com. But suffice it to say, the gold stock sector did the work it was supposed to do since August, 2020.
(more…)Back on October 14th we reviewed why a post-bubble contraction would be the proper time to buy gold mining stocks for fundamental reasons (even as they might possibly be dropping despite improving fundamentals). *
On October 28th we noted that the fundamental case has not engaged, not quite yet. We also noted big picture technical support parameters that need to hold for the play to avoid breaking down.
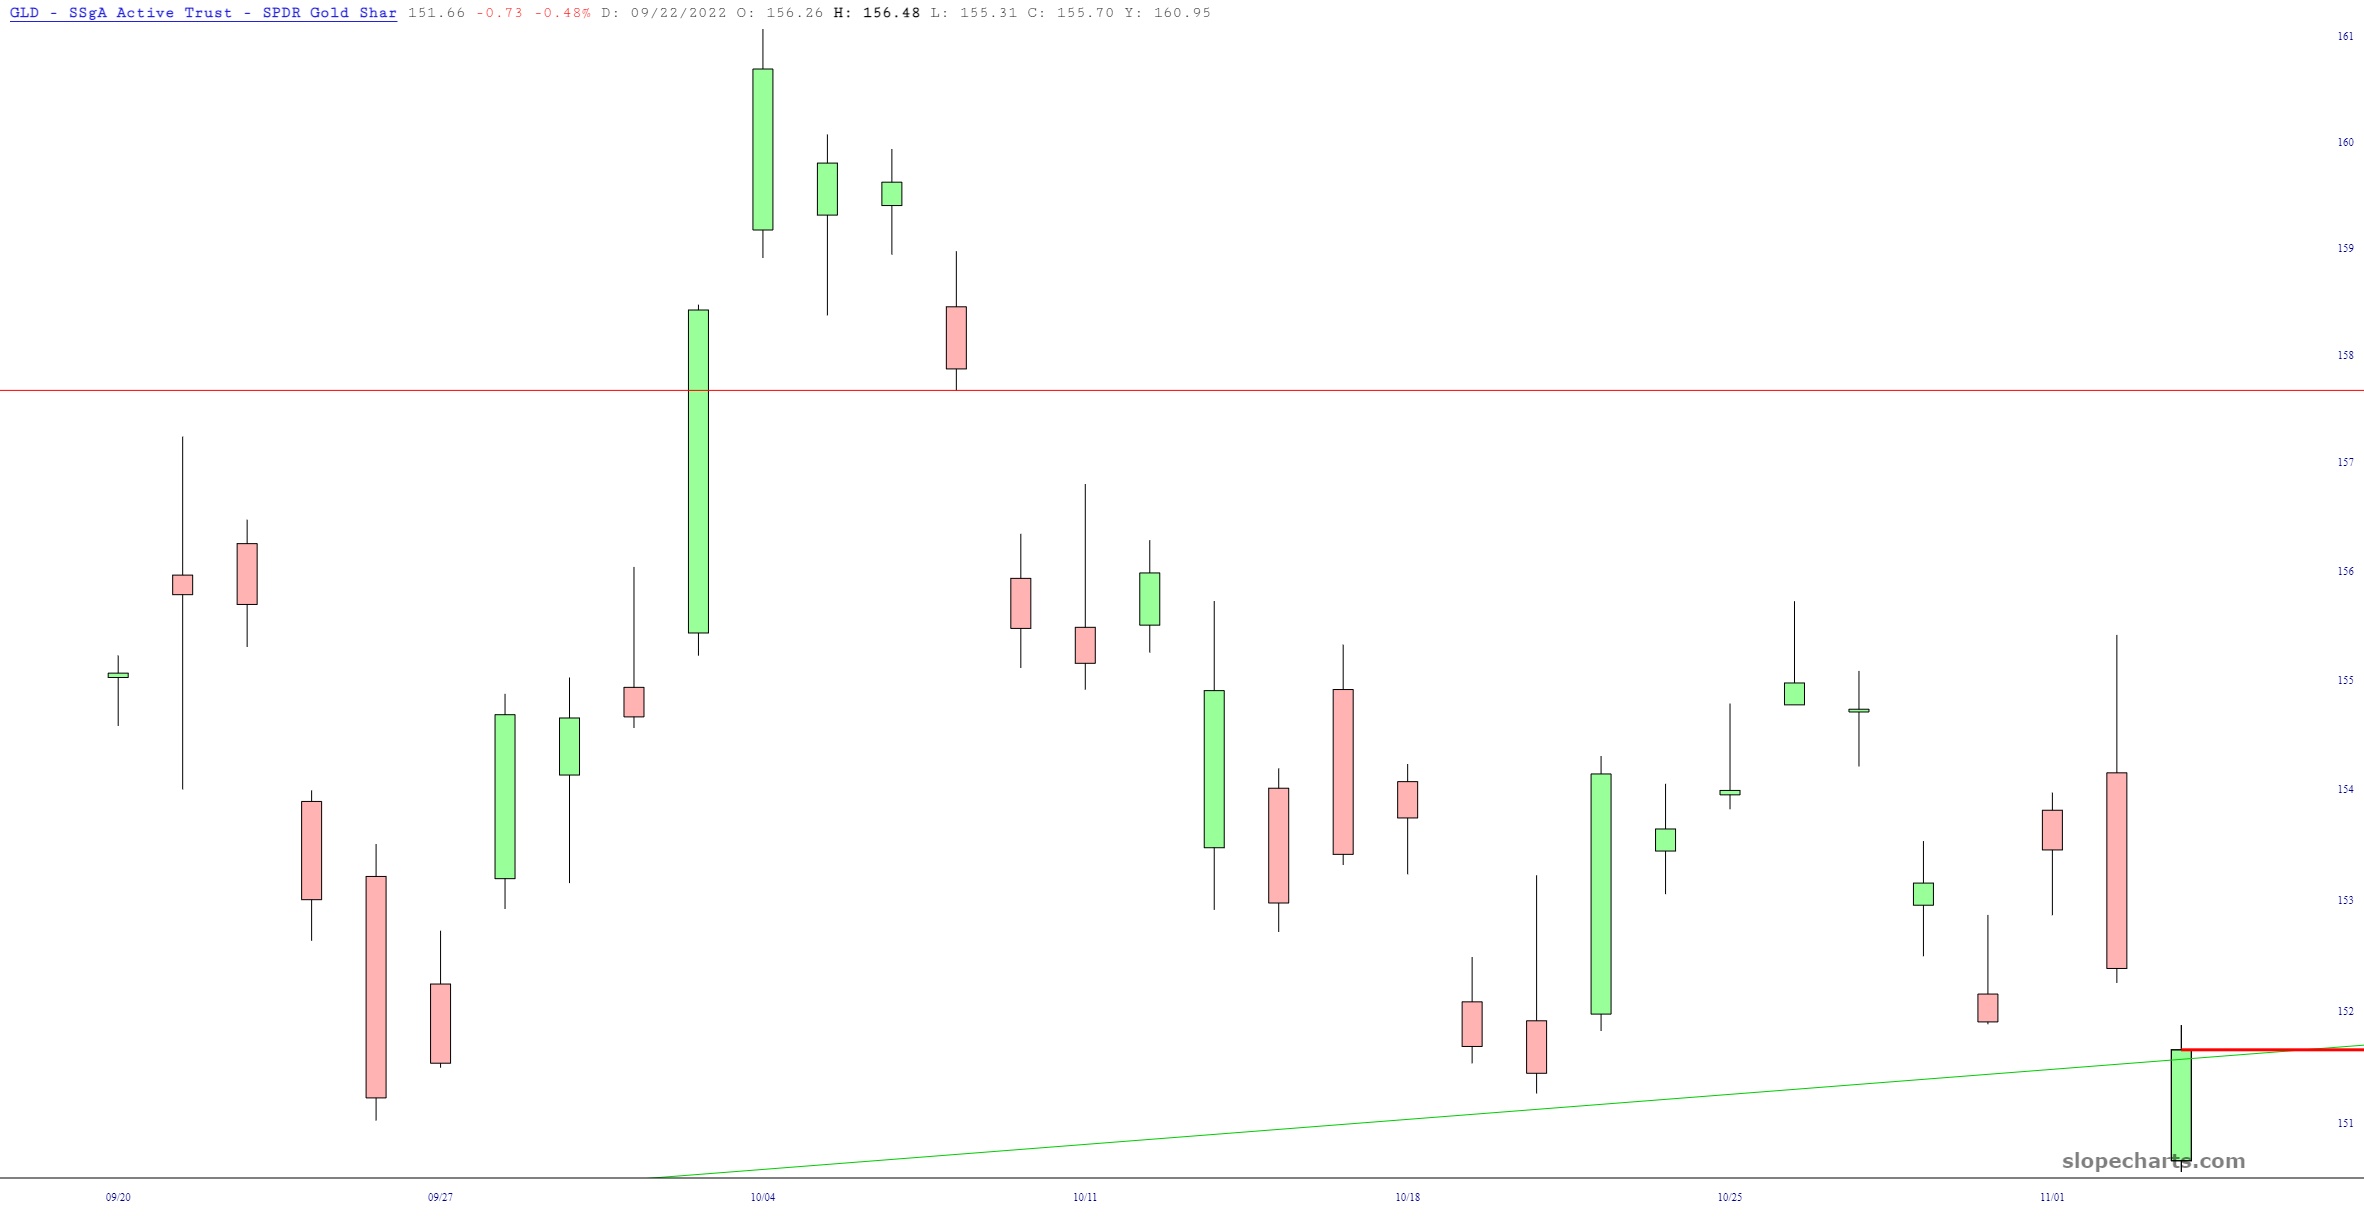
(more…)Not by much, but this is a huge trendline. I’ve said it before, and I’ll say it again. Gold sucks.