Could this be the start of something bigger?
Slope initially began as a blog, so this is where most of the website’s content resides. Here we have tens of thousands of posts dating back over a decade. These are listed in reverse chronological order. Click on any category icon below to see posts tagged with that particular subject, or click on a word in the category cloud on the right side of the screen for more specific choices.
Could this be the start of something bigger?
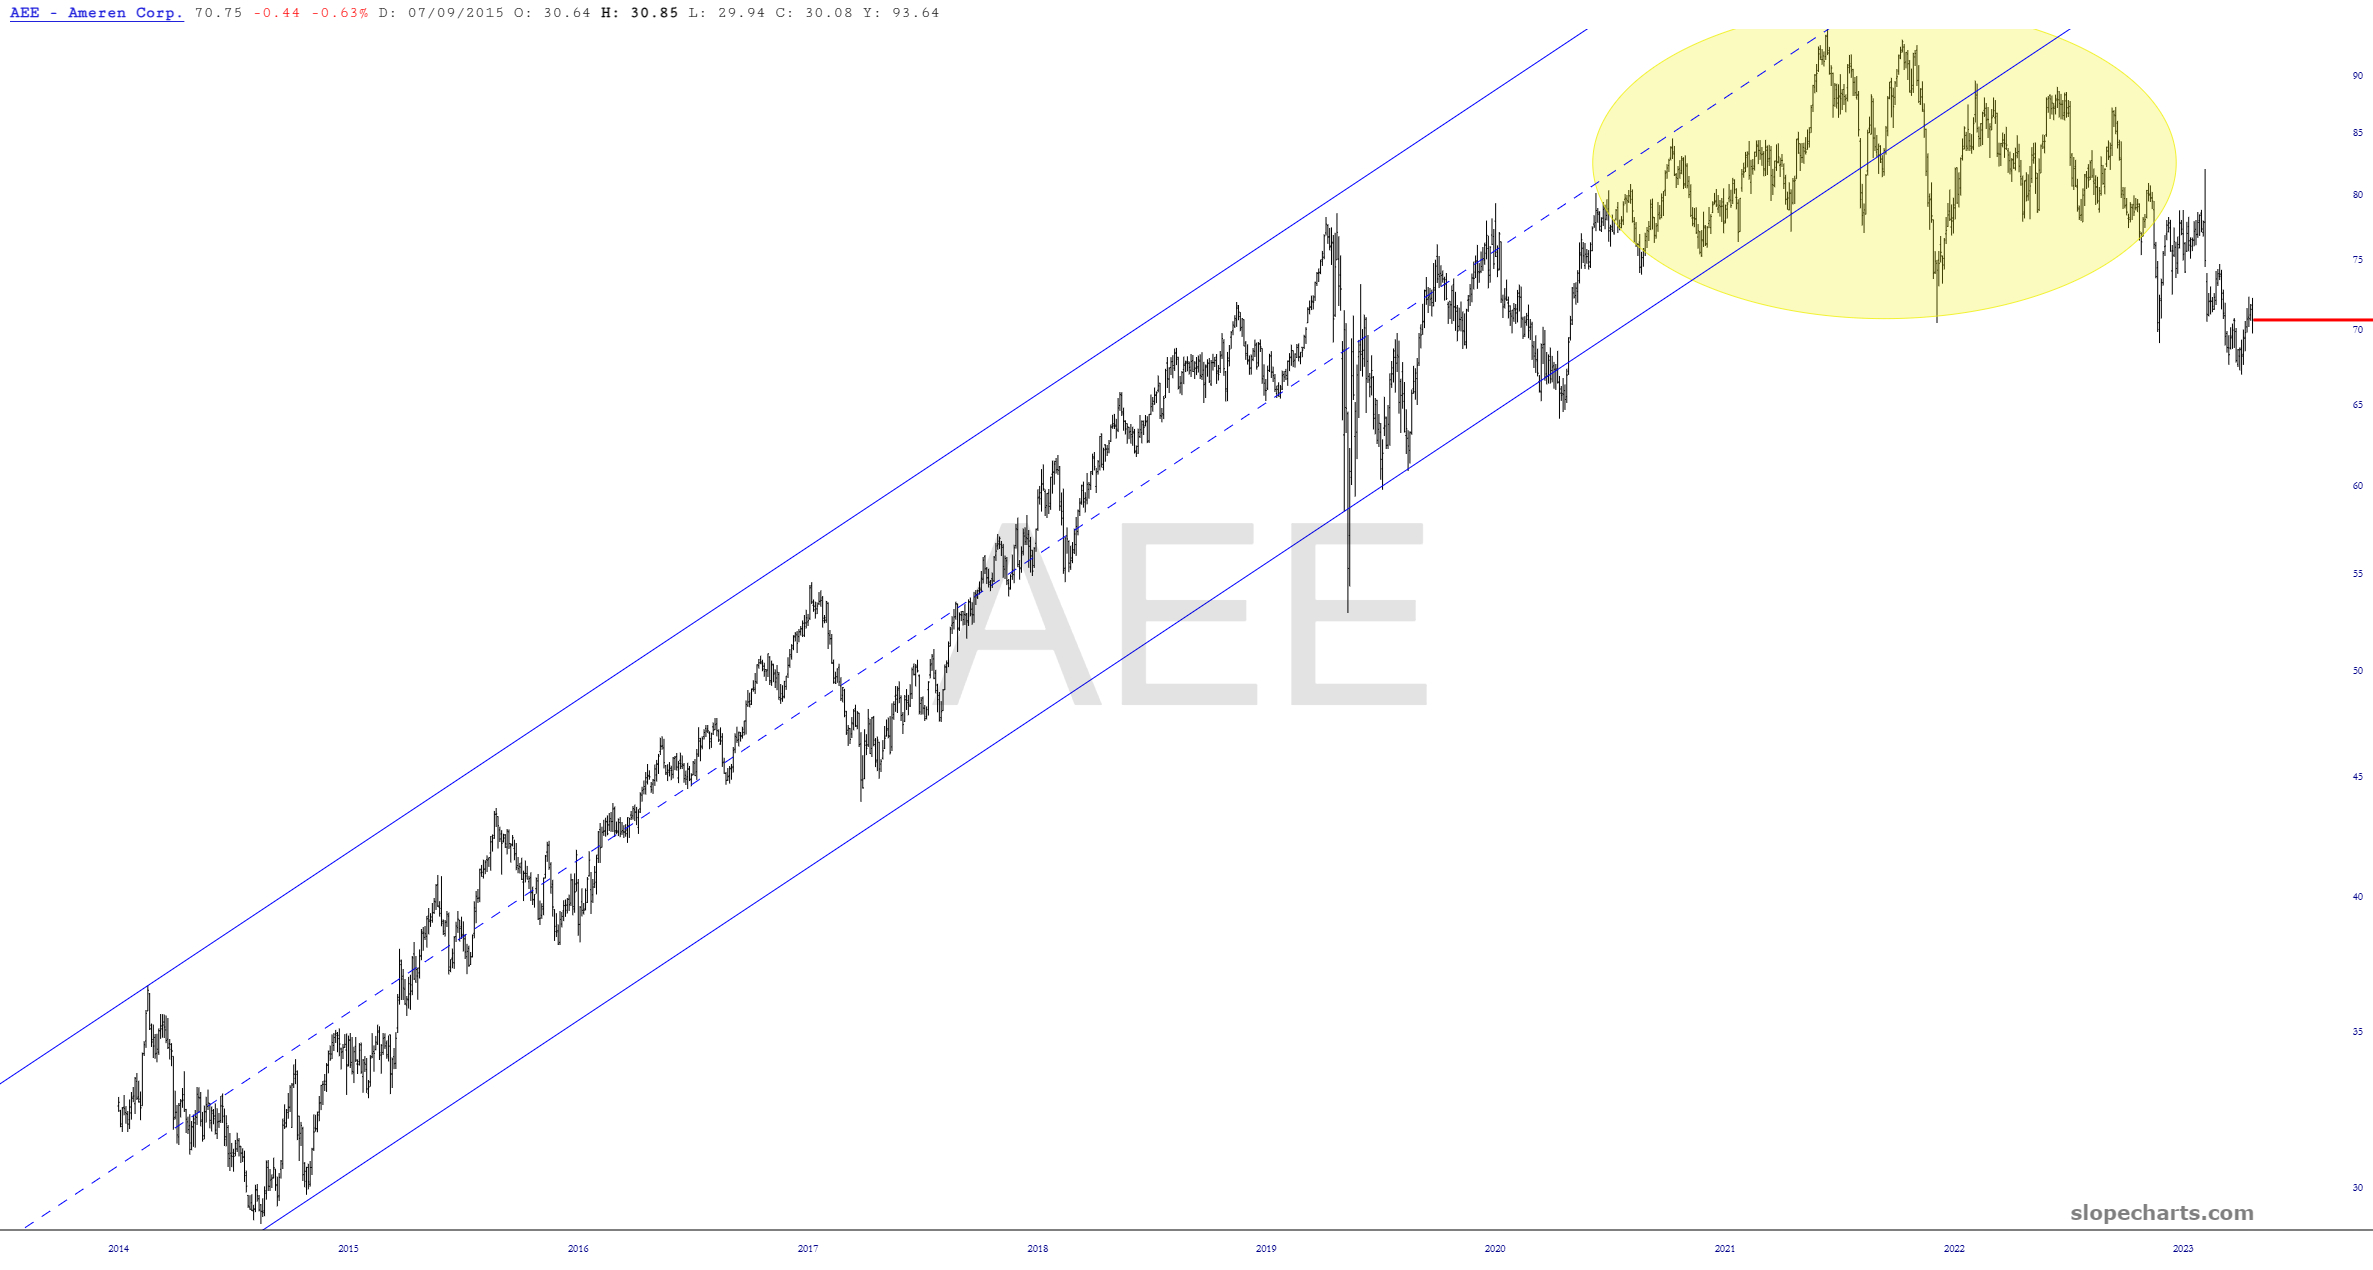
Just wanted to follow up on these two charts, which I had pointed out weeks earlier as bearish-looking diamond patterns. Nice to see them work out, finally!
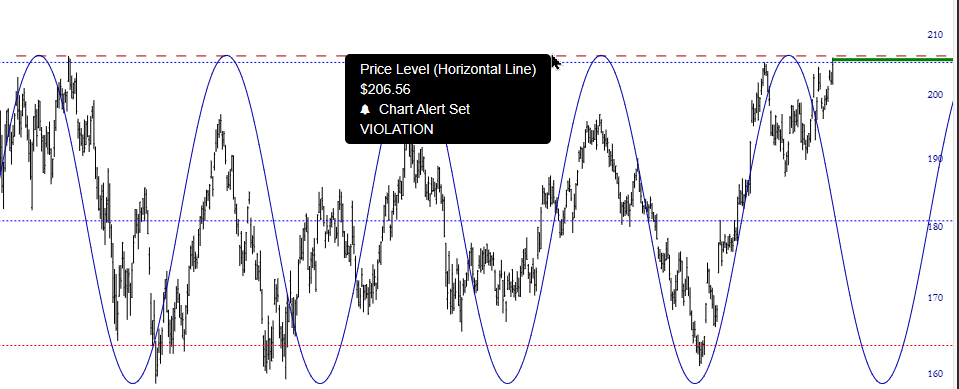
Let’s look at two ETFs with something important in common: their sinewaves. More specifically, the upper and lower extremes of these patterns, which by definition are a range. The first is the small caps fund, IWM, which has been range-bound for about two years, and today came THIS close (but not quite!) to breaking above its highest level, which remains set at March 29, 2022.
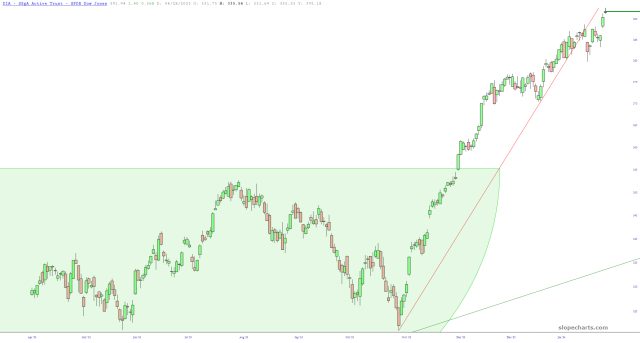
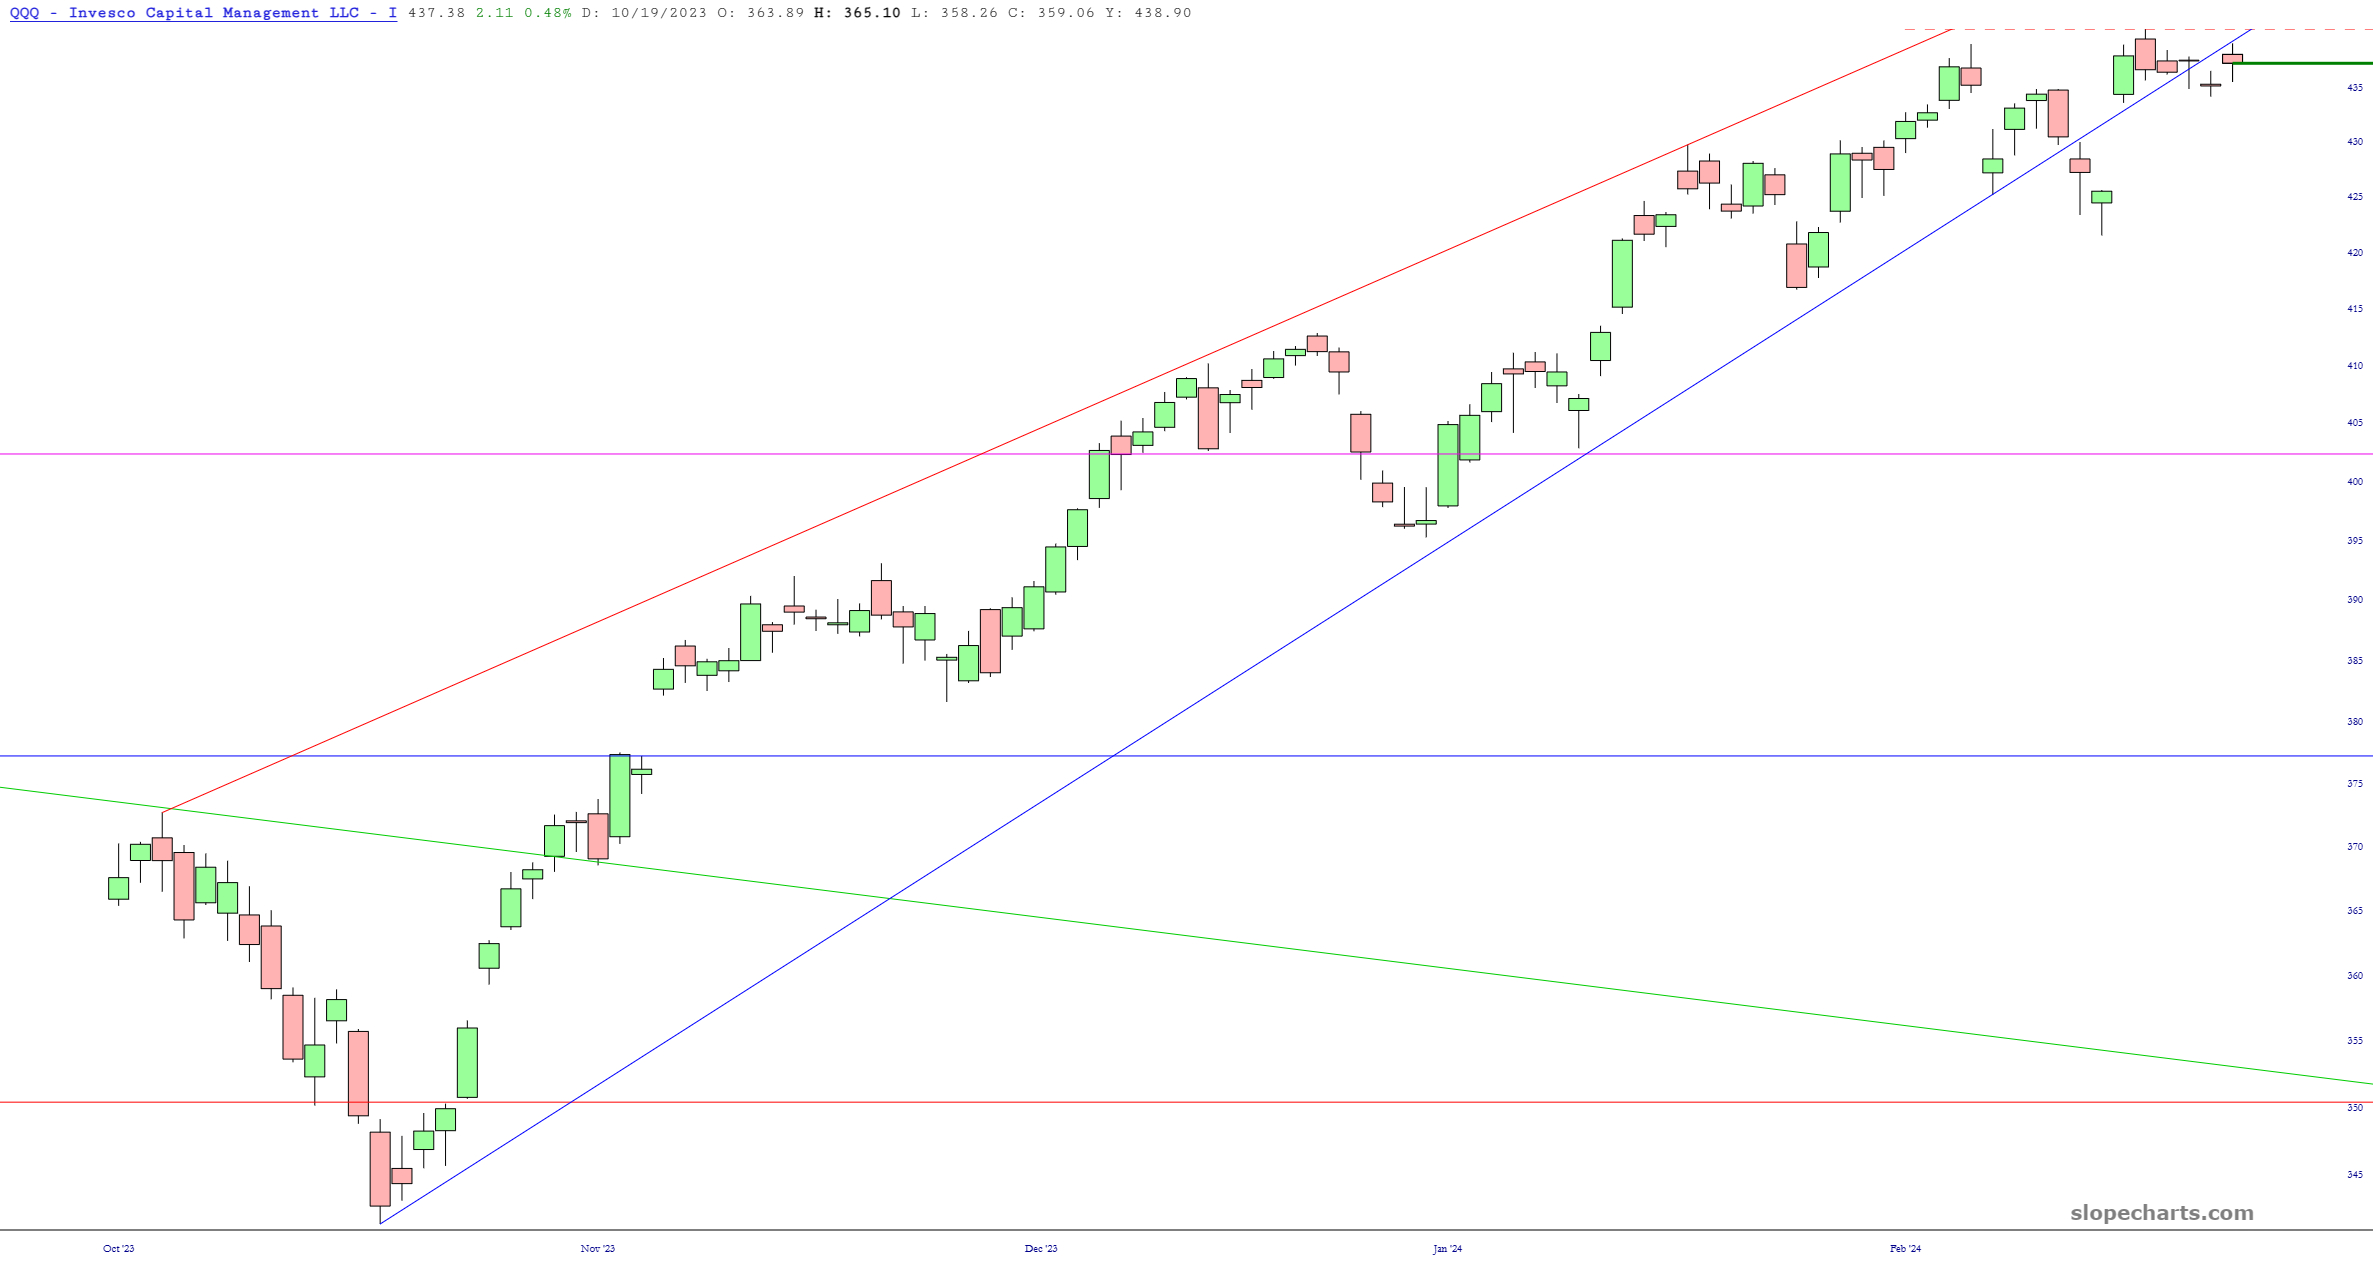
Below are the two biggest ETFs around. Interestingly, at their peak today, they were precisely, and I mean precisely, beneath their broken wedges. Worth noting!
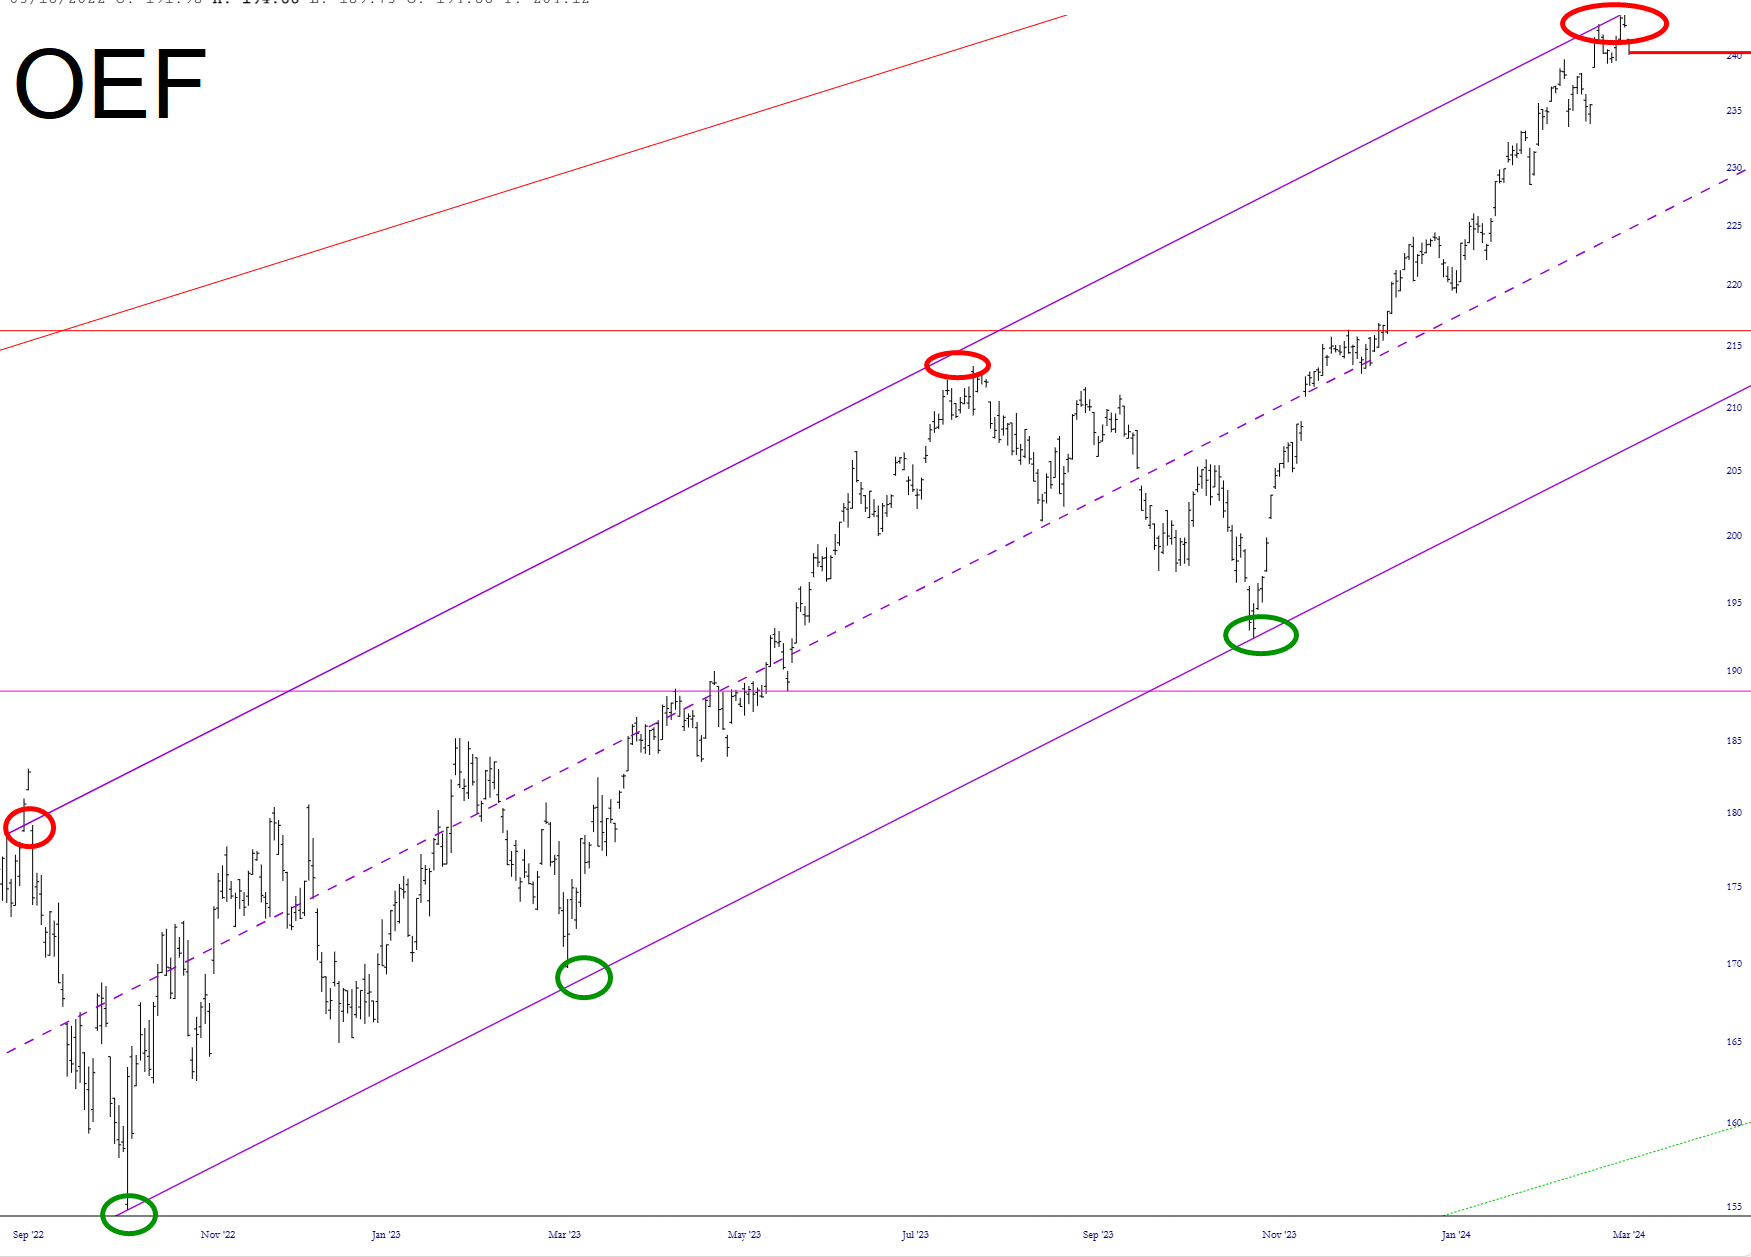
Kindly take note of the Dow 30 ETF, symbol DIA, and its relationship with its trendline. It was support. Now it is resistance. Yes, today is a lifetime high. And that is a phantom.