Finally.
Slope initially began as a blog, so this is where most of the website’s content resides. Here we have tens of thousands of posts dating back over a decade. These are listed in reverse chronological order. Click on any category icon below to see posts tagged with that particular subject, or click on a word in the category cloud on the right side of the screen for more specific choices.
In my last post on Wednesday 22nd October I was looking at the major support being tested on Bitcoin (BTCUSD), Solana (SOLUSD), and Ethereum (ETHUSD), and saying that sustained breaks below those support levels would boost the case that the bull market on Crypto has already ended, barring possible high retests as part of the topping process. This was and is a major inflection point, and the direction of the break from this inflection point is still in the balance.
I was noting that the last two bull market highs on Bitcoin were in December 2017 and November 2021, close to the end of the year and four years apart, so the end of 2025 is the obvious period to be looking for an end to the current bull market, and I’ve had that pencilled in at the likely topping area all year.
On the Bitcoin weekly chart the first big support is the weekly middle band, which was tested as support for six or the seven weeks before Bitcoin broke below it at the weekly close before last. That failed to confirm the support break at the end of last week with Bitcoin closing back above it. Bitcoin is back below that again at the moment.
(more…)Only a couple of days ago, I predicted Ripple ($XRP) would fall away from its right triangle pattern.

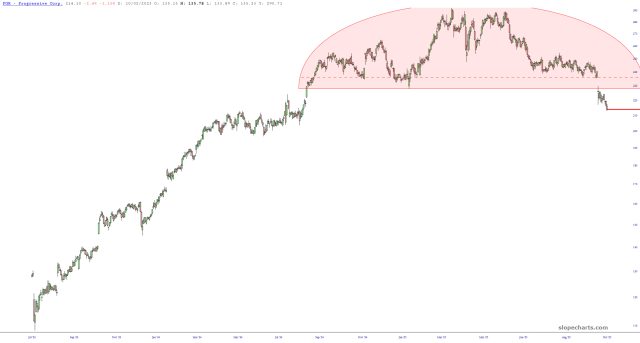
This is a big, beautiful top!