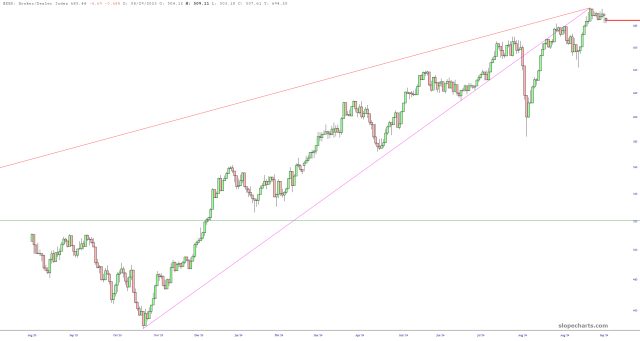
The Broker/Dealer Index ($XBD) is an item I’ve pointed out in recent days due to the price action’s relationship with the broken triangle. Once it tagged the apex, it was bye-bye.
Slope initially began as a blog, so this is where most of the website’s content resides. Here we have tens of thousands of posts dating back over a decade. These are listed in reverse chronological order. Click on any category icon below to see posts tagged with that particular subject, or click on a word in the category cloud on the right side of the screen for more specific choices.
The Broker/Dealer Index ($XBD) is an item I’ve pointed out in recent days due to the price action’s relationship with the broken triangle. Once it tagged the apex, it was bye-bye.
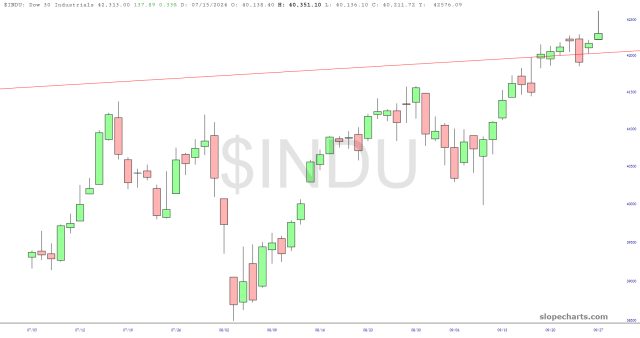
I was struck, while reading the latest Elliott Wave International Update, how despondent those chaps seem. I’ve read their stuff for many years, so I tend to know their tone and style, and they’re seriously in F-It mode at this point. I can understand why, as my white flag a few days ago illustrated, but I must say, I was impressed on Friday evening to see something on the Dow I haven’t seen in ages: a very well-formed shooting star candlestick.
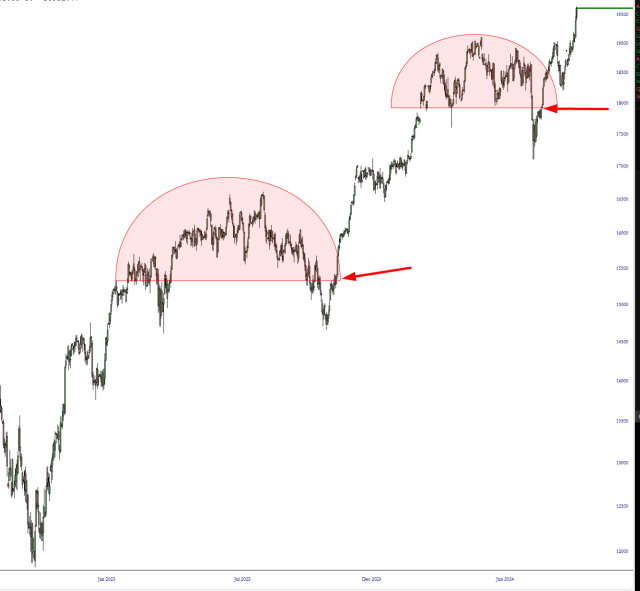
Below is a good example showing why pattern failure is as important as pattern success. On multiple occasions, this chart (the German stock market) SEEMED like it was breaking down, but instead (see arrows) the market rolled its eyes, flipped off the bears, and blasted higher. Patterns have value when they succeed AND when they fail.
I was looking at the nice short setup on Crypto earlier this week and both BTCUSD (Bitcoin) and SOLUSD (Solana) then broke back over the very obvious resistance at the 200dma. The obvious question is whether this is a break up and possibly that might be the case, but it doesn’t look like it.
A weak RSI 5 daily sell signal has fixed on ETHUSD (Ethereum), and a full daily RSI 5 sell signal has fixed on Solana. These have a solid history of making at least the minimum target at the 35 level on the daily RSI 5.
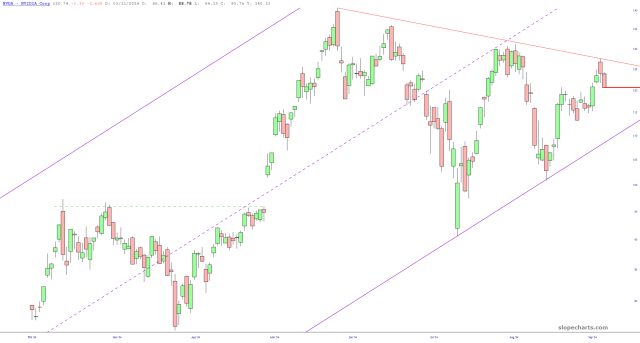
(more…)The king of all stocks, NVDA, is still confined by its symmetric triangle. A failure of the lower trendline would be quite the big deal.