Look, we are all wrong sometimes. That is because the markets are this way one day, that way the next and then something else the day after that. That is why we need bigger picture plans.
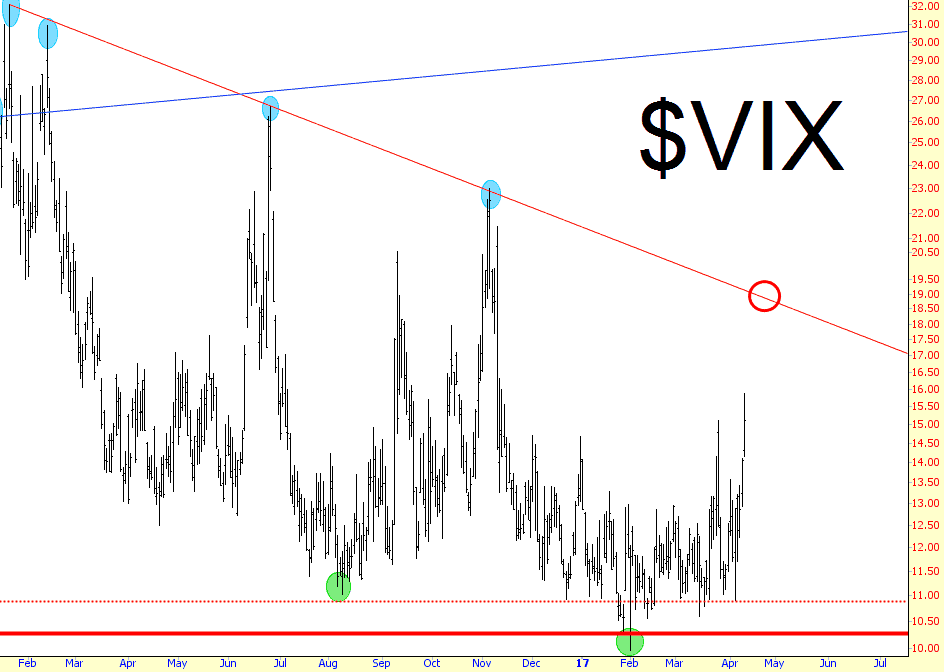
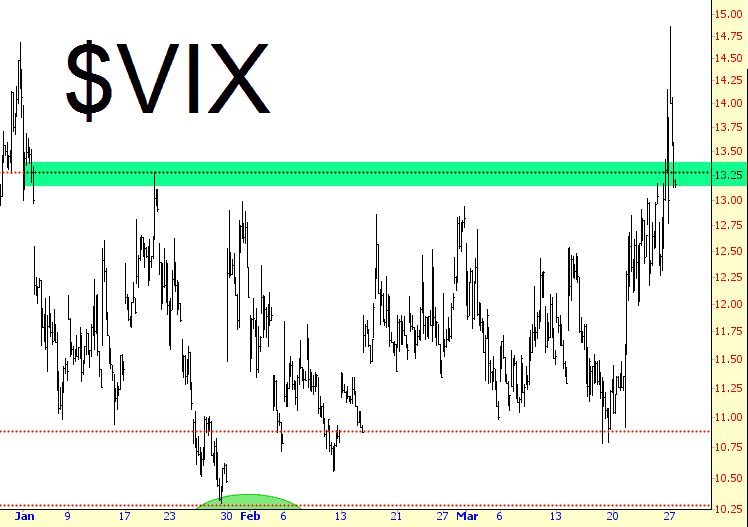
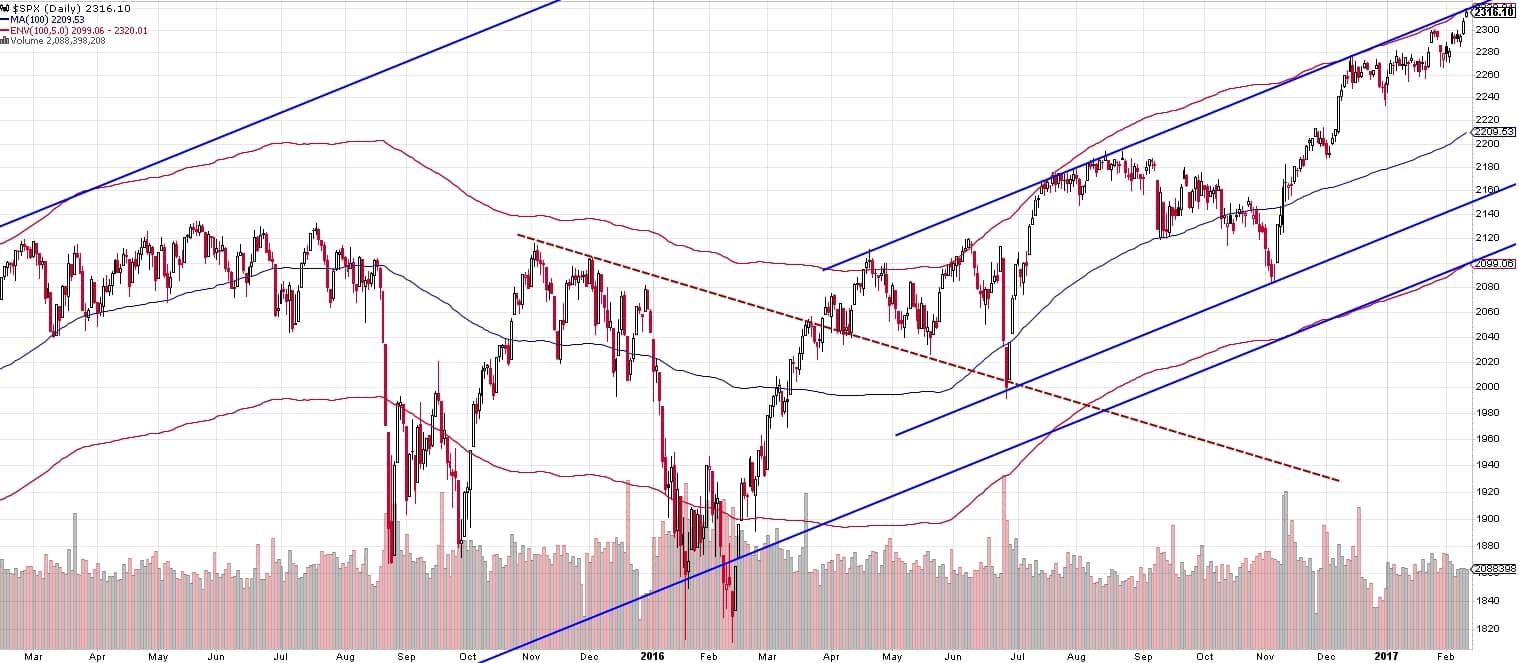
I for instance, have been guarded on the gold sector and technically at least, still need to see some upside parameters taken out. But today’s market information brings a potential fundamental underpinning as the stock market flirts with some important parameters of its own.