Slope of Hope Blog Posts
Slope initially began as a blog, so this is where most of the website’s content resides. Here we have tens of thousands of posts dating back over a decade. These are listed in reverse chronological order. Click on any category icon below to see posts tagged with that particular subject, or click on a word in the category cloud on the right side of the screen for more specific choices.
The Funnel of Excess (brendan burke)
Yesterday I finished a model I'm building for an electric generator. My first attempt at building this small device failed because I tried to violate the laws of physics. I live in a small Norwegian salmon fishing shack on the grounds of the large hadron collider in Switzerland. The shack was built by a very distant relative of mine that goes beyond 2nd's and remove's, but somehow this thin trace of blood was enough for me to take over his legacy job as grounds keeper of the inner circle of the collider.
I eat lunch in the cafeteria every day with all the other people from all over the world, luckily I have been able to get to know a few of them very well through a common interest in art. I asked them about violating laws of physics; if i just kept at it and worked hard enough would physics eventually cave in and give up. They said no. I laughed too, after all if these PHD's really knew anything they would be on Wall Street. That being said I described my invention and they proceeded to give me some simple solutions for proper use of magnetic fields. Hoek Vun! (means by the beard of the fermented shark in Norweigan) It worked! Now my generator is up and running and I can move to phase II on this alt energy project.
I have been trading since 2001 but I am working on a multitude of other projects so I can potentially cycle out of trading the markets. The end of the prosperity, the end of the semi fair game may be near for the US markets and all its players. As a result the end of value in your money and our society may also be near. With this risk plausible I don't want to be caught in the world with only the skills of a day/swing trader.
Careening:
It is not an easy task to accomplish, wrecking a globally powerful empire but history is full of examples. We may have entered not a Japanese style recession but rather an Italian one. Italy has been in a recession since the 400's, that's one thousand six hundred ten years, crappenshaft! So which is it, what recession are we in? Are we still in one? I guess so, things are a mixed bag of good and bad at the moment based on real world indicators. I am looking around me; the people I know whom have lost jobs, the foreclosure map on zillow, stores closed in otherwise prosperous places in my old neighborhood in Pasadena CA.
The violation of laws that would make a free market work could lead to economic ambiguity. If the stock market is kept inflated and continues to move unabated to untold heights it will be like building a meth lab in your heart. Its going to feel awesome to pump it right into the epicenter but eventually when the long haired chemists with jr high educations get it wrong its going to explode and paste your heart on the ceiling of your trailer. How long can we pump the market up and why are we doing it? What is the outcome? In our awesome service based economy the stock market has almost become the largest passive service industry of all. So much of the power paradigm relies on it going up. Pensions, senators, billionaires, investment bank warlords (whom make up our government), companies with no profit (many US companies seem to follow this interesting strategy of no profit). We have really collectively gone all in on the US market. Perhaps its the market itself and not its components that is too big to fail. We drain our best brains to wall street and our dumbest to Washington. We manufacture a moderate amount and we consume a lot of distraction. Now we are at a cross roads. We can take the pain and go through a very ugly recession in which everyone loses a lot, or we can use artificial means to inflate our biggest oxygen tank piggy bank. We have chosen… it has been chosen for us as the latter.
So now what happens? When you artificially inflate assets at an epic scale how do you step off the accelerator? How do you wean off the tit thats full of rainbow juice? It is very very hard. The only way you can is when a bigger boobie emerges behind it thats full of the real stuff; an actual producing economy. How do we grow a new economy? I personally think it needs to be driven by science and technology, manufacturing as we know it from boom times in the 20th century isn't necessarily the solution. We have botched our old real economy by allowing a slow ruin of the middle class through several presidencies and the pull of great minds into finance. There is an enormous challenge in the asset inflate stop gap that we are on. This is why I am moving on to other skill sets, at least until the market normalizes, if it ever does.
By going all in on the stock markets at a national level from government to individuals we may seal our fate into a vicious crack of inflation/deflation/muttonation. I don't know, it doesn't matter one word or the next, that's up to real economists to predict. What matters is trusting the market which is based on primarily illusion with your entire intellectual and physical wealth will at this juncture in our capitalist history possibly lead to personal ruin.
Mole’s Quick And Mostly Dirty Weekly Forecast
<shameless plug>The following was available to Evil Speculator subscribers over the weekend. Unlike other subscription blogs Evil Speculator has been shifted towards a hybrid system in which important analysis and trade ideas (i.e. symbols, setups, etc.) are available to subscribers first but are later opened to a general audience. If you are 'evil speculator curious' drop by for a visit anytime – we're up to no good on a constant basis.</shameless plug>
Alright, let's dig right in:
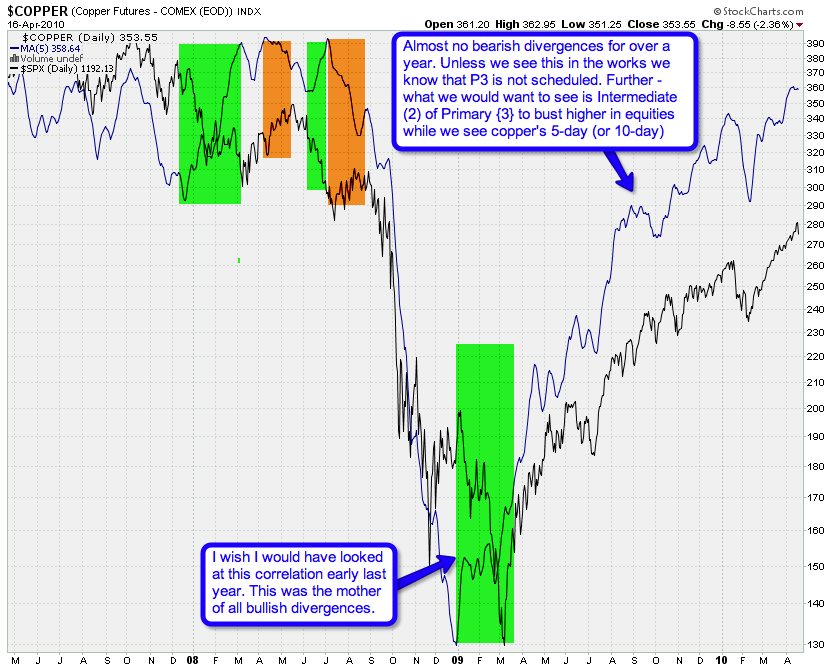
We are thinking long term here. This is my radioactive fusion
powered 5-day MA Copper/SPX chart. The MA is on the Copper futures and
what we are looking for are long term divergences. Yes, long
term – the short term is way too noisy for me to attach any
interpretations. Quite salient is the ‘mother of all bullish
divergences’ in March of 2009. Wish I would have seen this one back
then as it would have helped in assessing the timing of the finale of
the trend.
But wait – there is more. Let’s project forward a little and
consider what ‘may’ happen if we get something that may look like the
onset of Primary wave {3}. After the first major drop we would a see
snap back into Intermediate (2) – which should not be confirmed by the copper futures.
Remember – we are looking for divergences in the scope of Primary or at
least Intermediate degree moves. Anyway, it’s a good theory – for now –
let’s keep an eye out and put it into context along with some of the
other charts I’m peddling here.
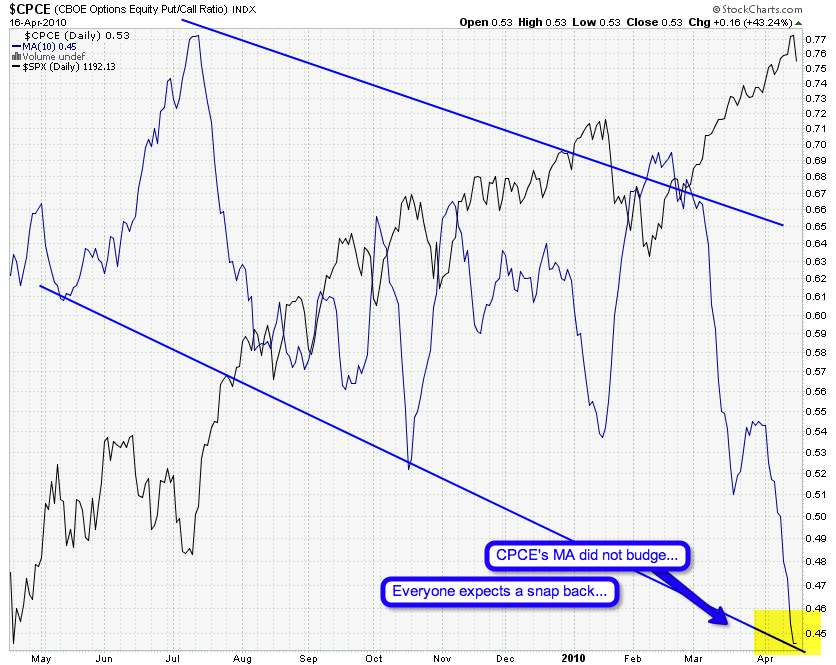
That’s this week’s shock and awe chart – I’m shocked that
the CPCE’s 10-day SMA did not budge after Friday’s drop. My take – the
bulls see this as nothing but yet another dip buying opportunity. Well
– we shall see shortly.
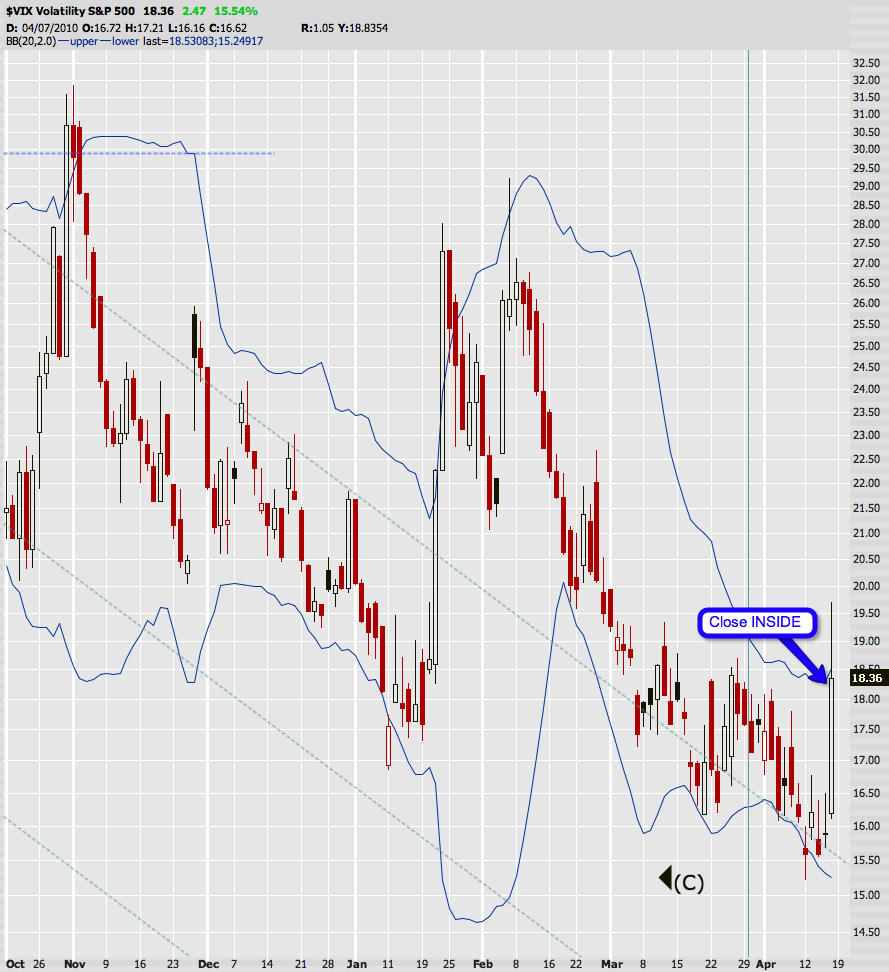
During Friday’s session got dangerously close to busting outside the
upper border of the 2.0 BB on Mr. VIX. Fortunately we did close inside
– meaning no buy signal (yet). Doesn’t mean we won’t get one though –
IMNSHO we might see a repeat of what happened late January.

I’m no P&F pro but that upper trendline I pointed out last week
seems to have served as resistance – thus far. If we get a drop to
1,180 on the S&P 500 cash index this chart would show a first
circle as a possible beginning of a downtrend. Not sure if that is a
‘confirmation’ of a reversal but it does count and becomes part of the
chart, so let’s just go with that unless we hear otherwise from a
P&F pro. I have highlighted the 1,180 mark on my wave count below
as well:
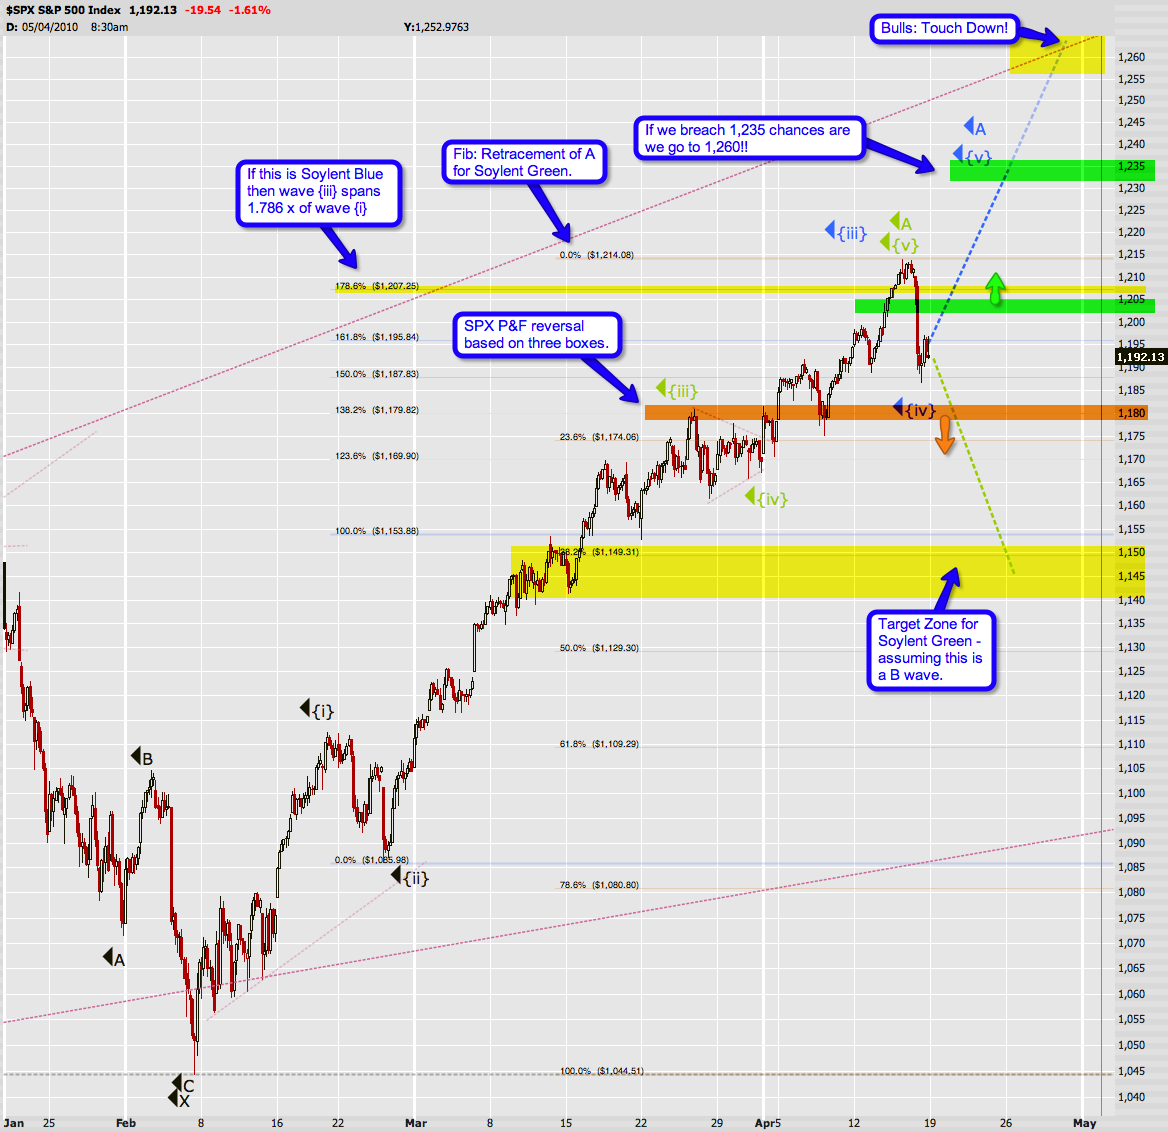
You might want to open this one in a separate window/tab by clicking
on it – it’s got quite a lot of detail. I won’t repeat all my comments
here but suffice to say that I have a feeling that things are slowly
shifting back into focus now. The retracements all line up quite nicely
and we might just have ourselves a map here.
Soylent Blue means that we are either done with Minute {iv} or will
be by around 1,180 – that P&F reversal point I highlighted above. I
postulate that we may bounce a bit before that and keep it off the
P&F chart – but that’s just a theory. If we keep dropping through
that point Soylent Green becomes a lot more realistic. The target for
Green is the 1,145 cluster as we are near a respectable fib lines, i.e.
38.2% on the way down and 100% of {i} on the way up. That’s right – I’m
the tamer of ferocious fib lines – Siegfried & Roy have nothing on
me ![]()
Some other comments on the chart – I think it’s a decent map – keep it handy as next week unfolds.
Cheers!
Mole
SPX Contest (by nummy)
Thanks to all who sent entries into the SPX Contest (http://slopeofhope.com/2010/03/spx-guessing-contest-and-slopefest.html). Also, thanks to Market Sniper and Biff for providing the prizes. So, I tried to think of something creative I could do with all of the entry data. But all I could come up with is a lame histogram. You can say more about data that has already occurred but you can only gather so much from a data series of educated guesses.
The day the contest entries closed, March 31, SPX closed at 1169. The mass of the entries is in the 1100-1150 range. Our guesses were, in general, below the close on March 31. Perhaps this is collectively our own bias showing up?
The mean of the entries is 1124 with a standard deviation of 72. The shape is, in general, a bell-curve shape. Assuming a normal, or Gaussian, distribution, this means that about 68% of entries were within 72 points of the mean. The entries aren't necessarily a normal distribution … a Weibull distribution may fit the data better. We can try to fit all kinds of distributions, but we can't gather much more information from doing that. What would be interesting to see is a volume profile of SPX from April 1 – May 7 (day after all of the entries closed until the contest date). Would be interesting to see how well the actual volume profile matches up to the histogram of the entries. Right now, all we'd have is some volume traded in the 1170-1200 (oh, so close on Monday!) range.
Woke up in the morning feelin’ like P Diddy (by Fayssoux)
Signs of extreme bullishness abound, whether in the plummeting VIX, net long speculative interest in the Nasdaq, put call ratios, bullish percentage indices, new highs, Dow 11000 hoopla, the Newsweek cover story on the Comeback Country, the $SLIX indicator, they almost got Art Cashin to capitulate on CNBC et. al. Someday, maybe soon, this will reverse direction, but who knows if there will be any bears left to see it happen. One measure of declining bearishness is seen in short interest. Tabulated below is some basic information from shortsqueeze.com relative to popular ETFs and a couple glamor stocks. The upshot — the wall of worry represented by shorts is a smoldering pile. To be short has been to be annihilated. It is within living memory when all these values were much higher, and ETFs were often hard to borrow. Will this evacuation of standing shorts accelerate the speed of the decline should it ever happen? Stands to reason, but reason is not leading the charge right now…
| Ticker | Sector/Type | Short Int Ratio | Short % Decrease |
| XLP | Consumer Staples | 3.8 | -20.9 |
| QQQQ | Nasdaq | 1.4 | -18.0 |
| IYR | REITs | 5.2 | -16.4 |
| SMH | Semiconductors | 2.3 | -15.6 |
| IWM | Russell 3000 | 3.4 | -12.7 |
| XLY | Consumer Discretionary | 3.2 | -12.3 |
| GDX | Gold & Silver Miners | 1.1 | -12.2 |
| XRT | Retail | 5.8 | -11.3 |
| XLF | Financials | 1.5 | -10.2 |
| SPY | S&P 500 | 1.3 | -7.6 |
| XLB | Materials | 2.0 | -7.0 |
| GLD | Gold | 1.0 | -3.1 |
| XLE | Energy | 1.7 | -1.9 |
| IBB | Biotech | 9.5 | 1.1 |
| EFA | MSCI EAFE | 2.3 | 1.4 |
| IWN | Russell 3000 Value | 2.3 | 3.2 |
| AAPL | Tech | 0.5 | -35.2 |
| GOOG | Tech | 0.9 | -27.3 |
| FCX | Copper | 2.0 | -2.8 |
| BAC | Financials | 0.6 | -11.9 |
