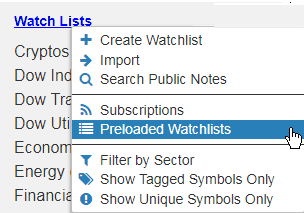
SlopeCharts has had the pre-loaded watchlists feature for a while now. You can see detailed information about it by clicking here. Most of you already know how to access these lists, by clicking on the Watch Lists link:
Slope of Hope Blog Posts
Slope initially began as a blog, so this is where most of the website’s content resides. Here we have tens of thousands of posts dating back over a decade. These are listed in reverse chronological order. Click on any category icon below to see posts tagged with that particular subject, or click on a word in the category cloud on the right side of the screen for more specific choices.
SlopeCharts Has Pivot Points!
First of all, I’m pleased to let you know that the comments notifications via email work again! That is, when you “@” someone or when you click the Follow button on a comment, you will get those emails like the good old days. Please be prepared for a MEGATON OF EMAIL as the servers catch up with a month’s worth. Sorry about the spam, but it has to clear it all out.
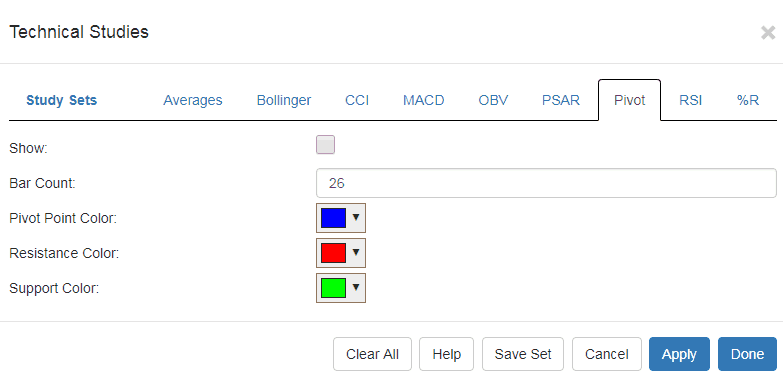
I have another bit of good news for you, though: SlopeCharts now has the Pivot Points study.
Pivot Points are a series of five horizontal line segments drawn on the chart to indicate zones of support and resistance. Because these are based on daily data, the line segments themselves span one month at a time. In other words, the pivot points for June are based on May’s daily data, those for May are based on April’s daily data, and so on.
Applying this study is done by clicking the Studies button in the upper right of SlopeCharts and clicking Customize. That brings up the dialog box with all the available studies. Click on Pivot to choose Pivot Points. In that tab you will see the checkbox (to display the study) as well as the dropdowns to change the default colors and the number used for the bar count. You will normally just leave these alone and check the checkbox then click Done.
Seven Paths for SlopeCharts
Now that we’ve got our new technical infrastructure firmly in place, we’re getting development momentum again. There will be times that one important new feature rolls out each and every day. This has been one such week.
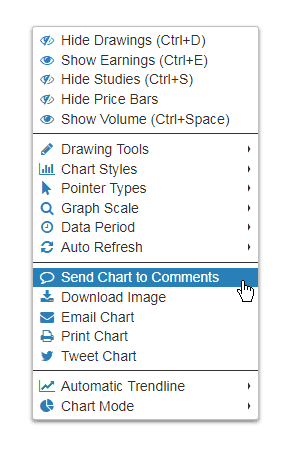
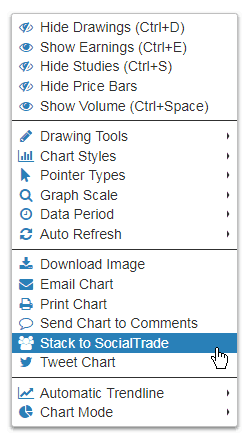
I want you to know there are now seven distincts to make use of a chart from SlopeCharts. The most obvious, is (1) viewing it on your screen. That’s pretty much where everyone else’s charts stop. But when you right-click on the chart and present the menu, you’ll see you can also (2) download the image to your drive (3) email the chart, including an optional message (4) print it (5) push the charts to the comments stream (6) or send it to your Twitter followers. There is a number (7), however, which is:
SlopeCharts in Comments!
I am delighted to tell you about a feature I’ve been anxious to release: SlopeCharts in Comments. What I mean by this is that you can “push” a SlopeChart, with whatever drawn objects, indicators, notes, or anything else you’ve put on it, directly into the comments stream. You can also add a remark to accompany the chart, although that isn’t required.
This just adds to the other ways you can “distribute” SlopeCharts already, including emailing, printing, and downloading.
Using this new feature is a snap. From within SlopeCharts, just click the Menu button or right-click anywhere on the chart to present the menu. You see the new choice: