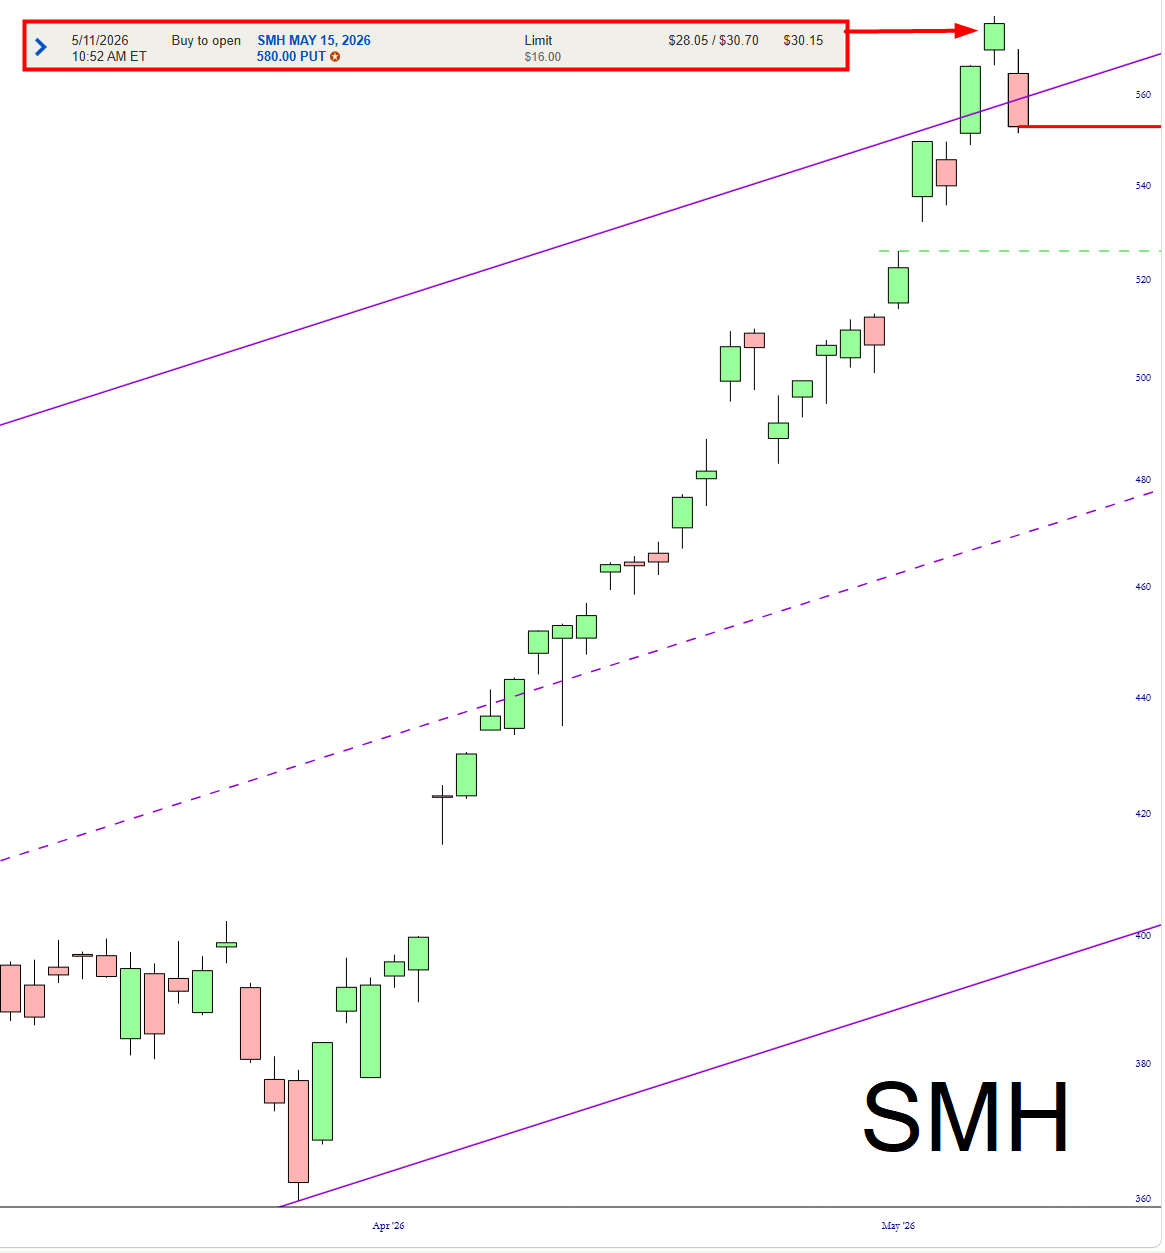
Well, well, well. How swiftly things do change.

Slope initially began as a blog, so this is where most of the website’s content resides. Here we have tens of thousands of posts dating back over a decade. These are listed in reverse chronological order. Click on any category icon below to see posts tagged with that particular subject, or click on a word in the category cloud on the right side of the screen for more specific choices.
Here, in a single chart, is the failure of the bulls (which is everyone except me and maybe two folks here on Slope) to take back control of the market.

One shouldn’t fill in the Trader’s Diary on Slope until day’s end, but I’ve already decided to give myself an “A” for the day (which, trust me, is rare). In short, what I’ve done in the first hour is:
The minute bar chart of /YM kind of says it all: as is so often the case after a shock event, the gap got filled (and then some), affirming the wisdom of getting the devil out of those puts at a super profit.

I took risk from 170% down to 88% and am now back up to 137% since I think the (ridiculous) buying may well be past us. Onward!!
What a weekend, eh? Looking at the 5-minute bar chart of the NASDAQ futures, it’s almost quaint to remember the NVDA price spike from only three trading sessions ago (post-close Wednesday), marked with the red arrow (dur-hay). That was truly the last gasp as the market, crazy as the news is, is actually following a marvelously steady slide in a series of Tim-loving lower lows and lower highs.

One of the truer sayings in the world of trading is, “If something goes down when it’s supposed to go up, sell it.” With that in mind, I present to you Nvidia this morning:
