
(As a reminder, you can get free, real-time crypto charts in SlopeCharts).
Forty thousand dollars per bitcoin. One hundred thousand. Three hundred thousand. The predictions are as numerous as the people making them.
I don’t pretend to know which one is going to be reality, and neither should anyone else. I do find the simplified presentation of price movements during manias to be an interesting road map, however. We all know that last week cryptos went crazy, with some losing more than half their value. On Friday, and into this weekend, they are beginning to strengthen, and I suspect many crypto-bulls have heaved a sigh of relief and are comforted by the fact this was just another one of those scary downturns. They don’t say HODL for nothing, you know.
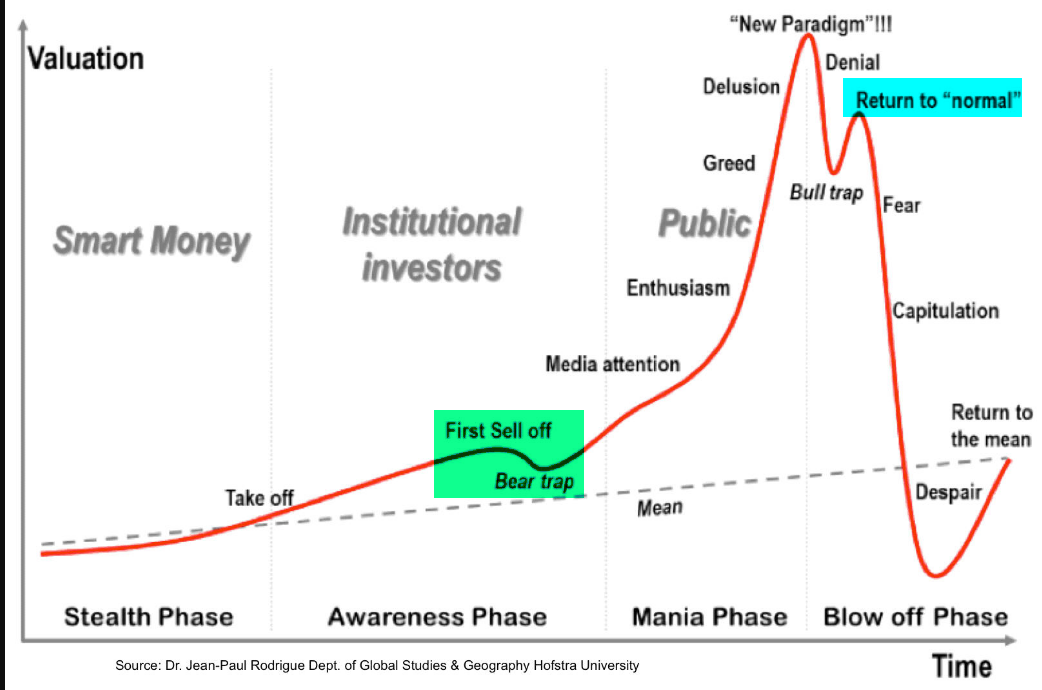
The zealots, I imagine, would point to the green tinted area I’ve highlighted above as the current state of affairs. That is, we’re still in the “awareness phase”, and, yeah, there was a sharp, scary selloff, but all it’s going to mean is that the pantywaists aren’t going to stick around for the man-sized gains.
Maybe. Maybe not.
To my mind, it’s also plausible that what we saw was more along the lines of the cyan-tinted zone. What happens to cryptos this week might be an important “tell” in that respect.
If prices continue to stabilize and eventually bolt past the lifetime highs we saw not long ago, it will simply egg on the crypto crowd, because it will be the umpteenth example that selloffs are temporary and, for the bold, buying opportunities. They can all get back to the game of seeing Who Can Utter The Most Outlandish Prediction.
On the other hand, if the cryptos can’t muster their way past those highs – – if, instead, they stall out, start to weaken and…….gasp…….slip before the selloff levels we witnessed late last week, it’s going to stoke the flames of fear flickering from Friday.
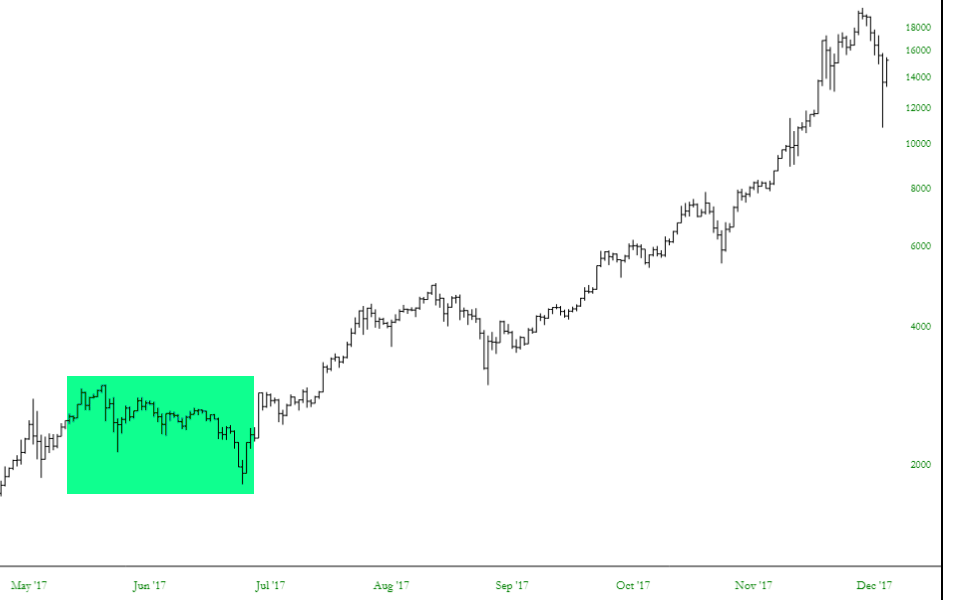
I’m somewhat in the “Post-New Paradigm” camp, myself, and would humbly suggest comparing the price chart above (and its tint) to the earlier diagram.
